jason w. jones

software from the trenches

Configuring Drillbridge with Financial Reporting Web Studio

Drillbridge works perfectly with Financial Reporting Web Studio – the successor to the desktop-based version of Financial Reporting (also commonly called HFR, FR). FR was stuck with a very archaic client (let’s just say it’s from around the Clinton administration), but it has revamped for the future, with a completely web-based interface now. In retrospect, and based on my interactions with the interface, I think this product overall can be thought of as gap coverage for FR users. It’s not necessarily the place you want to do new development, especially given some of the other shifts/developments in the reporting ecosystem lately. My colleague Opal Alapat has posted some really great thoughts on FR and its place in this ever-changing world, which I encourage you to read.

In the meantime, there are countless current installs of FR that organizations need to support and perhaps transition to this newer incarnation of FR. As with before, Drillbridge works seamlessly to give you and your users advanced drill-through capabilities in Smart View, Hyperion Planning/PBCS, FR, and now FR web. I found that the UI had a few quirks to it, but I’ll walk through a simple example and try to point those out along the way.

First things first, let’s login to Workspace:

Hyperion Workspace main login page

Default Workspace page

The Tools menu contains our launcher for the web studio:

Hyperion Workspace main screen with Tools menu showing options, including Launch Reporting Web Studio

Launching Reporting Web Studio from Tools menu

Once we’re there, we should see something like this (results will vary based on your environment of course):

Financial Reporting Web Studio editor page, with a report being edited

FR Web Studio editor editing a particular report, with data cell properties selected

In the preceding screenshot, I have a very simple FR report already opened, and further, it contains a data grid (Grid1). You can’t see it in the above screenshot I have further selected one of the data cells in the Grid1 layout, which has updated the contents of the rightmost pane in the screenshot (Cell Properties). This is where I can setup related content (drill-through). Clicking on the Setup… button brings up the following dialog:

Add Related Content Dialog in Financial Reporting Web Studio

Adding Related Content (notice the chain icon)

There are no related content definitions, yet, hence the empty list on the right. This is where things got a little funky for me in the UI. It seems that I couldn’t actually edit things in the listbox once I added them, even though it ostensibly let me edit them. I had to remove them and re-add them, and make sure that the title/URL were set exactly right on the first try. Further, the UI is also a little unintuitive in terms of adding custom related content (such as for the Drillbridge definitions), but not too bad. To add a Drillbridge definition, click on the chain/link icon in the top left, then click on the right arrow. This will bring up the following dialog:

Related Content Properties dialog screen on Add Related Content in Financial Reporting Web Studio

Default Related Content properties

Now we can set the Drillbridge report title (it can be anything you want, it’s just the display value in FR, but you are encouraged to make it the same title as you have set for your Drillbridge definition and deployed to Essbase), and a Drillbridge URL (provided by Drillbridge, or customized by yourself):

Related Content Properties editor filled in with a Drillbridge report title and URL definition

Putting in a Drillbridge title and report URL definition

For reference, here’s that URL:

http://localhost:9220/drill/sample-basic-transactions/v2?sso=$SSO_TOKEN$&$ATTR(ds,id,pos,gen,level.edge)$

Note: don’t use localhost in your environment. I was able to use this because I had a Drillbridge server running on my actual machine (as in my same laptop that was using Firefox to login to FR in the first place) but this should be your actual static Drillbridge server. Also, if you are incredibly eagle-eyed and a Drillbridge aficionado, you might have noticed that rather than specifying a Drillbridge report number in the URL, I’m using the new “logical alias” feature, to specify a more friendly report name of sample-basic-transactions.

This is a really killer feature in Drillbridge that I’ve covered before but I’ll go into briefly. You can give your reports an arbitrary, URL-friendly name (no spaces/special characters) and use that to launch Drillbridge reports now. You can still use the numeric ID if you want, of course. But using the logical alias makes migrations easier, and makes logs a lot easier to read through, among other things. I definitely recommend using this feature if you can.

Now we can save the related content by clicking on OK. It’s now added to the list of available related content:

Add Related Content dialog in Financial Reporting Studio with a single drill-through definition

Viewing added Related Content after saving report definition

Let’s now go launch an HTML preview of the report by navigating to the File menu and selecting HTML Preview:

Financial Reporting Studio web editor with File menu highlighting the HTML Preview menu option

Launching HTML Preview to test things out

Giving us something like this (notice the hyperlinked data cells):

HTML Preview of a Financial Reporting Web Studio report

HTML preview for a our simple report (notice data cells are hyperlinks)

I can now click on one of the data cells to launch the Drillbridge drill-through report. For testing purposes, I have turned the Drillbridge debugging feature (link is primarily about an attribute dimension feature but also contains background on the debug feature) on for this particular report, which means that Drillbridge will just generate the SQL query and render that to the screen, without actually executing the query. This is really useful for testing and development. Let’s see what query Drillbridge generates:

Firefox Web Browser showing a Drillbridge report with debugging turned on

The resulting Drillbridge report (note that debugging is turned on)

This looks good. Notice that the FY15 member was translated to 2015, as per this report’s query definition (to strip the FY prefix and prepend the value of 20). I’ll now turn off debugging for this report and launch it again:

Firefox web browser showing a Drillbridge report that contains no data

Drillbridge report with debugging turned off (intentionally has no data)

As it turns out, there is no data in my test database for this particular intersection, which is fine. Nicely enough, one of the newer refinements to Drillbridge includes some helpful text such that when the query finishes, if there was no data, Drillbridge will indicate as much. This is a small but helpful usability improvement to prevent use-cases where a user might think a long-running query is executing, but in fact there is no data). Let’s change to a different year member and launch the report one more time:

Firefox web browser showing a typical Drillbridge report named Sample Basic Transactions

Changing to a POV with data and relaunching

Success!

And of course, as always I can download the data to Excel with just a click:

Drillbridge report data downloaded to Excel

Downloading to Excel

Wrapping Up

I hope you found this article on configuring Drillbridge with Financial Reporting’s fully web-capable incarnation to be interesting. Drillbridge continues to be an incredibly useful tool for helping companies quickly enhance the value of their cubes, whether on-premise or on the cloud – please don’t hesitate to reach out to me if you have any questions.


Milestone for PBJ (PBCS REST API Java Client) Project: first outside contribution

Just a quick note on a fun milestone for the PBJ project: the first code contribution from an outside developer has been merged into the codebase. This is one of the things I love about open source. The PBJ project has a very flexible license (Apache Software License 2.0) and as such it is quite business friendly.

Sometimes when an open source project doesn’t do what you need it to do at a given point in time you have to roll up your sleeves and add some code yourself. And that’s exactly what one of the users of the library needed when they added some new methods to download large files from PBCS. So there are a couple of new methods for handling that use-case – and now everyone gets to benefit from it. This is exactly what I had envisioned when I created this project: a high-quality codebase with complete documentation, unit tests, and support for some of the exciting REST APIs being provided by modern Oracle technologies, and a chance to enjoy living one of my favorite quotes: a rising tide lifts all boats.

PBCS has a REST API, now what?

Note: this article was originally written for an ODTUG publication, but it never wound up getting published. So I thought I would just post it here instead.

Oracle’s Planning and Budgeting Cloud Service – PBCS – is the first Hyperion product to get the full cloud treatment. In addition to Planning’s move to the cloud, it has picked up a couple of new tricks. One of these new features is a REST API. This article will give a quick background on REST APIs, some integration opportunities now available to PBCS users, and information on how the PBCS REST API can be easily used from Java.

For those that aren’t familiar, a REST API typically means a few things to developers. First of all, an API is an application programming interface. From a developer standpoint, an API gives us the ability to write programs that interact with another system in a specific way. In the case of PBCS, the API provides access to functionality such as refreshing a cube, launching a business rule, uploading files, getting member information, and more.

APIs have been around for decades. This whole REST business is a little newer. REST APIs, or “RESTful web services” are APIs that are accessed over the web using the same technology that a web browser uses to communicate with websites on the internet. Additionally, REST APIs are often designed in a specific way that models objects and actions in an organized hierarchy. Lastly, the typical request and response is formatted as JSON object. JSON is a popular data format that originated in the JavaScript programming language. You can think of it as a lightweight, easy to read text format that can represent arbitrarily complex information.

One of the great things about REST APIs is that they open up a lot of integration opportunities that might not have existed before. In the past, when it came to interacting with a system such as PBCS, developers were often completely reliant on the third-party such as Oracle to develop libraries in a specific programming language such as C++ or Java. But since a REST API just uses common protocols and data formats, almost any modern programming language can interact with it. Now instead of maybe just a couple of languages being supported, it’s relatively easy to get up and running, be it C++, Java, JavaScript, Python, PHP, Groovy, PowerShell or something else.

The PBCS automation tool itself – epmautomate – uses the PBCS REST API to run rules, refresh cubes, and more. This brings me to my main point. For many organizations, the epmautomate tool is going to be the quickest and simplest way to script automation. But many organizations are going to need to interact with PBCS in other ways.

There are numerous integration use-cases for the PBCS that will involve the REST API. For example, an organization may want to write automation in a higher-level programming language than the command line. Or they may need to kick off a job on PBCS or fetch live member information programmatically. These things are both easily achievable.

For integration scenarios that do happen to be in the Java programming language, there is even already a bespoke Java library that works with the PBCS REST API and makes automation possible with just a few lines of code. This library is called PBJ (PBCS Java Client) and is an open source library that is freely available. It can be found at http://github.com/jasonwjones/pbj-pbcs-client along with documentation and examples of how to use the library.

Lastly, for those that want to interact with the PBCS REST API using another language, the PBJ library can be used as a reference and complement to the Oracle documentation on how certain functions work. I can’t overstate this last point quite enough: all APIs and libraries (especially new ones!) have their quirks, so when someone has already figured it out, use their experience when you can in order to speed up your own development.

New Drillbridge Plus feature: fetch attributes!

Drillbridge Plus has recently gained a new feature at the request of a customer. This one is kind of interesting and required a bit of deep thinking in terms of the best way to architect it. Here’s the deal: Smart View will let you drill-through on a data value where your grid is using attribute dimensions, but it won’t pass the attribute associations as part of the request. And as it turns out, there are instances where it’d be useful to have that attribute member so you can use it to dial in the SQL query that Drillbridge creates and executes.

What to do? Ask Drillbridge to go fetch those attribute member values for you anyway! In this post I’m going to walk through a use-case showing off the new feature, how to set it up, and I’m also going to show off some recent debugging enhancements that are really useful and have been around for awhile.

Let’s start. First, consider a normal Drillbridge report definition with a simple query:

A normal Drillbridge report definition (before adding attributes)

The preceding example is a typical Drillbridge definition that works with our good-ole’-friend-til-the-end Sample/Basic. Well, actually it’s a modified Sample/Basic that has a Years dimension, but you get the idea. In this example, Drillbridge will perform a pretty common conversion where the year member such as FY18 is converted into the value ‘2018’ to be used in the SQL query. This is accomplished with the handy built-in Drillbridge function, #removeStarting, which works really well here because it can safely handle values without throwing exceptions.

Let’s now go turn on the debugging feature on the options page:

Turning on debugging for the Drillbridge report

This is a relatively new feature to Drillbridge but is incredibly helpful for debugging and developing report definitions. When debugging is turned on, instead of executing the SQL query, Drillbridge just creates it as it normally would, but then just outputs the query without actually executing it. This is really great for development when you have a long-running query that you don’t want to wait for, or you just need to exactly compare your SQL syntax to a known-working example, and don’t want to dig it out of the logs. Turning on debugging for this example will let us see exactly if our attribute variables are working how they are supposed to be working.

Let’s go ahead and take a look at the debugging feature in action before we get going with anything attribute related. Over to the Test screen:

Testing the Drillbridge report with debugging turned on

Verifying Drillbridge report output with debugging turned on:

Viewing thew SQL output of the Drillbridge report with debugging turned on

Okay, so our “base case” is looking good. Now let’s get some attribute variables working. Let’s head back over to the options page and turn on the attribute fetching feature as well as specify which dimensions it should apply to:

Turning on and configuring new Attribute options on Drillbridge options page

Notice the Attributes category and how the attribute checkbox is now checked, and I have specifically told Drillbridge that it applies to the Market dimension. I can specify additional dimensions but adding them in to this definition and separating them with commas.

Now, back over to the report definition. If it wasn’t set already, I absolutely have to make sure that the Essbase Connection is set for the report, so that Drillbridge knows which outline to open up and pull attributes for. Here I have made sure to specify the Sample/Basic cube my local epmvirt11124 server as the associated Essbase server (these connections are configured on the Drillbridge Servers page):

Setting the Essbase Connection on the Drillbridge report definition

With all of that out of the way, I can now edit my Drillbridge query to reference the new variables that will be available. Let’s go ahead and add in some “short tokens” to represent the Market and Population dimensions:

Updating the Drillbridge report definition to use a new attribute variable reference (Population)

Short tokens are a sort of technique where we can just put in a simple definition of a Drillbridge token, then use the convenient token editor (note: token editor also only available in licensed version of Drillbridge) to dial in the configuration. The format for a short token is a dimension name with a pound sign (or octothorp, if you want to get fancy), surrounded by double curly braces. With the query updated with these short tokens, I can now navigate over to the token editor to edit their specific settings:

Navigating to the Token Editor

Then select the token:

Selecting a token to edit

Now edit its details:

Updating sample value to help with testing

For the Market token I’ll just say it has a default value of Washington, in order to facilitate testing. With the tokens all saved I can now go to the testing page again:

Testing the modified report

I don’t need to specify a value for Population since it’s dynamically populated as per the report configuration. Let’s build it:

Verifying the the proper attribute association shows up for the Population variable

Success! You can see that the variable #Population has been populated for us by Drillbridge, by fetching the value associated attribute value for the specified Market from the outline (in this case, that value is Small_6000000). I can treat it like I would any other Drillbridge query variable: I can prepend things, take substrings, or whatever other transformations I need in order to craft exactly the SQL query that will be most useful.

Just for fun, I’ll go add in that we now want to test to see how the “Pkg Type” attribute dimension is handled. This is an interesting case because as commonly happens with Drillbridge queries, we have a space in the dimension name. Because variables need to not have spaces, Drillbridge will convert them to use underscores instead. So we can refer to the Pkg Type attribute variable as #Pkg_Type, then test the query:

Testing with additional attribute variables

And here are the results (note that Drillbridge fetched the value “Can” for our package type from the corresponding attribute dimension):

Verifying the output with additional variables (“Can”) package type

Lastly, just for the sake of completeness, here’s what some of the relevant sections of the outline look like in EAS:

Comparing to outline in EAS

For testing purposes, do note that the raw member name (100-10) was used for the Product, rather than the alias of Cola, which actually wouldn’t pull back the needed attribute value. The member name/alias were the same in the case of Market/Washington, so it wasn’t an issue.

All For Now

That’s all for now – this new feature is available in the latest licensed version of Drillbridge. It’s a seemingly simple feature but I know it will be helpful in a handful of situations for various organizations, especially ones that use attribute dimensions to keep the size of a cube down. Please don’t hesitate to reach out if you have any questions about Drillbridge or this new feature.

People really hate VBA

Stack Overflow did a really great article on the most disliked programming languages that I thought was really interesting, with my own little Essbase twist on it. On Stack’s jobs site, they let people specify which technologies they’d rather not work with. Tops on the list are Perl, Delphi, and VBA. PHP and Objective-C are next but they don’t have near as much dislike as the top three.

So, why all the hate? To me, these all have intuitive explanations, and at least in the case of Perl and VBA, I think it has to do with the context in which “projects” with these technologies occur. Perl and VBA are frequently used as quick and dirty scripting languages to automate some process. And often these one-off automation solutions tend to grow. I could be charitable and say that these solutions grow “organically” but it’s probably more often the case that they grow haphazardly – which is perhaps also being charitable.

I think people are indicating they dislike these languages because they just don’t want to work on them and don’t have good experiences working with their sprawling, complicated, hard to debug, and incredibly sparsely documented codebases. Briefly, and skipping down the list to Objective-C, I think that’s indicated as disliked mostly because it is “out of favor” with respect to the Swift programming language. The iOS ecosystem is incredibly fast-paced and people seem to need to aggressively keep their skills fresh.

As it pertains to Essbase, I couldn’t help but think of my own corporate and consulting experience when it comes to VBA solutions. I can’t tell you how many times I got a call because there was a problem with some workbook that had some VBA code on it. It can be incredibly frustrating (and in the case of bringing in a consultant, expensive) to debug, fix, and enhance these solutions.

Quite simply, while the VBA-based solutions provide something valuable (automation, saved time, etc.) they become an absolute albatross in finance departments and make upgrades/migrations just that much more difficult. That’s one of the reasons that I think Dodeca is such an effective solution in numerous cases where VBA was used, because many of the things you needed VBA code for are just inherent features of the product, with zero code at all.

For example, without a single line of code, Dodeca can connect to Essbase, pull members from an outline and present them as dynamic selections to users, retrieve multiple cubes into multiple ranges on multiple tabs in a workbook, send data back to Essbase, and run calculation scripts. These are features that typically make up pages and pages of low-quality, low-value VBA code and often necessitates the continued usage of the old, unsupported classic add-in.

Dodeca 7.3 Workbook Scripts Enhancements Overview

Today I’d like to continue on the theme of new functionality in the latest release of Dodeca, version 7.3 that came out some time ago. I talked about the new Outline Viewer functionality and MDX enhancements already, today I wanted to give a brief overview of some of the new functionality in Workbook Scripts (WBS).

If you’re not familiar, Workbook Scripts are optional scripts that can be added to views that provide advanced functionality inside of views. You can think of it as a modern, more maintainable analog to VBA, optimized to work in a world of Essbase-based data on spreadsheets. Dodeca 7.3 included some new methods and functions. There’s also updated Dodeca 7.3 WBS documentation available on the web.

New & Updated Procedures

CopyFromBinaryArtifact

The new CopyFromBinaryArtifact method is potentially the most interesting new method to show up. There are overloads for copying a whole sheet or copying a range from a particular binary artifact (i.e. a completely separate Excel sheet than the current view). So this potentially allows organizations to centralize some information, formatting, data, or other stuff into a central sheet, then refer to it. I could see people using this to store small amounts of data that they want to reuse in a view (thereby obviating the need to put the data in a bespoke relational table/cube), or copying some common formatting elements into a new view. So, this new method potentially opens up some significant maintenance savings and other possibilities in a lot of cases

OpenApplication

OpenApplication can be used to launch a different application instance from the current one. This can be useful for user convenience, where instead of telling the user that they need to go to a separate app, you can launch it for them.

SaveWorkbookAsCsv

The SaveWorkbookAsCsv method is pretty much what it sounds like. In addition to being able to save the workbook as a CSV file using the UI, you can perform this via WBS. I see Dodeca used in many cases providing some quasi-ETL functionality, or being used for large data dumps, so this could be handy. For example, maybe you want to allow users to drill into relational data and then automatically download it to their desktop.

AddDataCache: EssbaseMDXScript

There’s a new EssbaseMDXScript overload available as part of AddDataCache. The Data Cache functionality is really handy in many instances, especially where you want to execute an “expensive” (in terms of query time) query but then be able to do multiple things with the data without having to re-run the query. Now you can cache data based on an MDX query in addition to the normal options with report scripts, SQL, and more.

SendEmail (new Zip options)

SendEmail gained a couple of new properties to zip attachments. This method is already used quite heavily to have Dodeca generate and email large, complex books of reports (Excel and PDF) and mail them around. This is quite frequently used as part of batch reporting. This functionality is used so extensively by so many organizations that it is now useful to compress the output into a single file and attach that to the email. Now with a single option you can do exactly that.

Miscellaneous

There are a few other tidbits here and there like a new attributes property on the EssbaseReport method, some new convenience functions like getting the first column letter, last column letter, checking if a binary artifact exists, if a view is shared, and more.

Read the Release Notes!

The release notes that ship with the Dodeca distribution contain pretty detailed notes on all of the new functionality and features, so be sure to peruse those for other new functionality you might be interested in. If you are planning to use some of these new procedures/methods, please let me know if you do and how useful you find them, I’d love to hear about it.


Dodeca: Turn on Auto Build button by default or hide it entirely

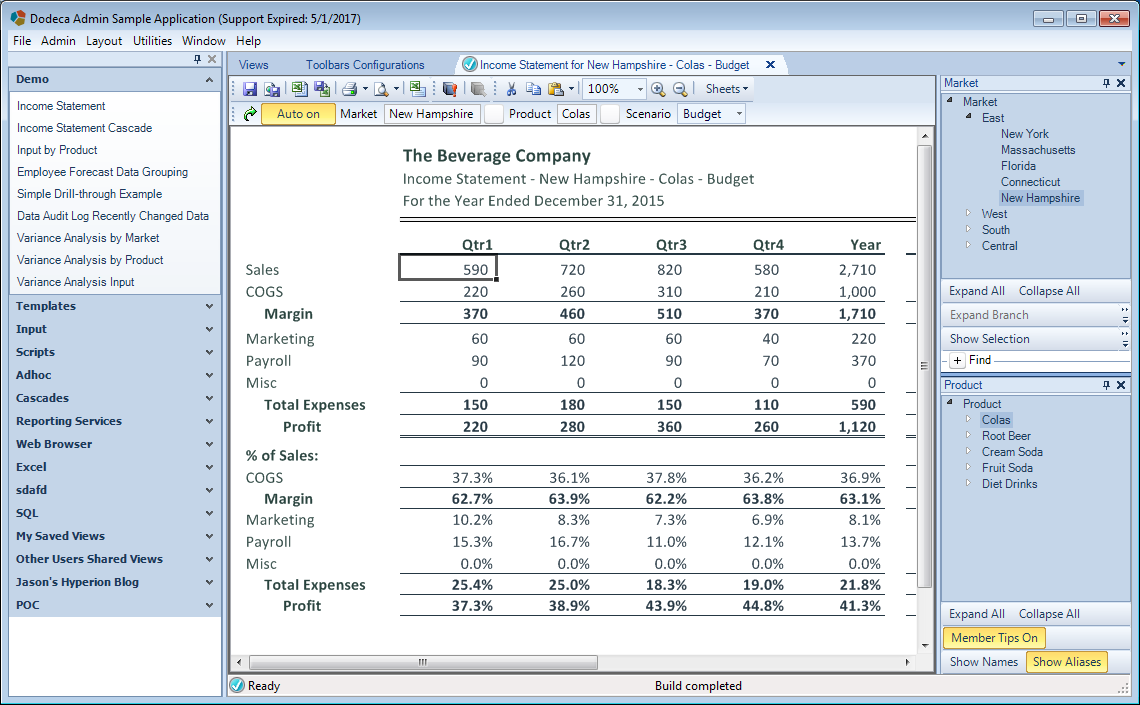
A customer request came in the other day asking if it’s possible to turn the Auto build button on by default. You can see this button next to the green build button in this screenshot:

A Dodeca view with Auto on turned on by default

Validating in our view that the Auto on button was indeed on by default

Given a default set of toolbars that ship with Dodeca, this button typically starts in the “off” state. In case you’re not familiar, the effect when it’s on is that any time you change an item in a selector, the current view will be rebuilt. This can make it really convenient to browse through different views of data without having to press the build button (you can see this in the video at the end of this article). It’s just one of those usability things that makes interacting with data just that much more fluid.

So the question is, can we turn this button on by default so we can save ourselves (and our users) a click right off the bat, especially if we know we want to use auto build? We absolutely can – but this isn’t actually a “normal” view property, it’s part of the toolbar. So instead of updating a typical property on the view, we’re going to update an aspect of the toolbar that the view users, and but the toolbar itself is a view property. So for my given view, let’s go check out what the toolbar in use is:

Viewing the toolbar configuration for a view in Dodeca (ViewToolbarsConfigurationID)

Viewing the toolbar configuration for a view in Dodeca (ViewToolbarsConfigurationID)

The main toolbar here is a toolbar called “Essbase View Standard Limited” – this is the property ViewToolbarsConfigurationID. This is a pretty typical toolbar. One of the interesting things about Dodeca is that every single part of the GUI and toolbar can be configured, per application. I’ve riffed on this before, but to me this is just an absolutely staggering amount of configurability for a product to provide out of the box. It’s not like we’re modifying some arcane config file and voiding our warranty, either – it’s just how it is.

Put another way – I sometimes use a car analogy to conceptualize how Dodeca relates to Essbase. Insofar that Essbase provides an engine, Dodeca provides the wheels, windows, A/C, and more. You may be used to picking your trim level for a car – heated seats, a sun roof, and then some – but in the car analogy, the amount of configurability that Dodeca gives you is akin to being able to choose the frame you want – down to the alloy it’s made from.

“…in the car analogy, the amount of configurability that Dodeca gives you is akin to being able to choose the frame you want – down to the alloy it’s made from.”

That said, we can quickly jump to the toolbar we want to edit by right clicking on it’s property cell in the view editor, then clicking on the context-specific menu that pops up. In this case we’ll see this:

Editing a specific Toolbar Configuration in Dodeca

Editing a specific Toolbar Configuration

Simply click on “Auto Off” so that the button appears highlighted (it’s on despite its apparent text), then save the toolbar. Upon refreshing the view we will indeed see that the view starts out with this button turned on (as in the very first screenshot of this article).

If we want, we can actually go a step further and make this button invisible. You’d likely want to leave the button visible so the user could turn it off, but maybe you want to clean things up a little or simplify them for your user. In this case, we can still make sure the button is technically turned on, but it’s just invisible. To do so, just expand the toolbar properties. This is a little bit to navigate: in the category Toolbars Manager Properties, expand ToolbarsManager > Tools > 26 – AutoBuildView > SharedProps > Visble and set it to False. In your toolbar/environment, the AutoBuildView button might have a different ID than 26, so find the proper button and edit its properties accordingly.

Now just save the toolbar and re-run the view:

An updated Dodeca view with an Auto build button that is invisible

Verifying that the auto on button is indeed invisible

As you’ll notice, the button is gone, but it’s still in effect. Here’s a really brief video of navigating through a view with auto build turned on. Note that every time I click on a new item in any of the selectors (whether it’s a tree, list, or dropdown), the view is rebuilt. This isn’t cached data, by the way. Dodeca is communicating with it’s highly optimized Essbase service, then in turn communicating with Essbase/OAC, then bringing the data back.

One Last Thing

Keep in mind that there are quite likely many other views that reference this toolbar, so these updates will affect all of them. You might not want that. In that case, you should just copy the toolbar, make your changes, and then update any views you want so that they point to the new toolbar.

Dodeca: Create and use a new Essbase MDX Selector List

The most recent version of Dodeca brought several exciting enhancements for MDX-related functionality. One of these is a new selector list based on a reusable MDX script object. Although MDX queries are probably most often associated with queries that return numerical data from a cube, they also have incredibly useful metadata capabilities that can be employed for various purposes. In Dodeca, it’s common to use a report script or member query specification to return members from an outline. For example, you might want to provide your users with a selector such that they can choose a particular product (or products) from your Product dimension in order to customize a report that they will build dynamically.

I see MDX scripts as being a natural, clean, and flexible way to populate these selectors, and moving forward I will recommend them whenever possible over the more arcane report scripts that have been around for years.

That all said, what I want to show today is the following: I’m going to edit an existing Dodeca view so as to replace one of its existing selector lists with a new list based on an MDX query.

Consider the following view for an Income Statement:

A built Dodeca view with selectors visible

Our existing view uses a typical selector for the Market dimension selection

As you can see, the user is able to choose a particular Market, Product, and Scenario and then build the view. The available members shown for the Market and Product selector lists are, of course, generated dynamically based on the outline of the Essbase connection associated with the view. But let’s say that I want to provide the user a list of very particular items from the Market dimension. In this case, I want to make it so the user only sees and has to choose from members from the Market dimension that are both at level 1 and have a certain UDA (“Major Market”).

Create the Essbase MDX Script

Let’s navigate over to the new Essbase Scripts tab (Admin > Essbase Scripts). At the moment, I don’t have any scripts (this is actually a copy of Dodeca running out of a Docker container and I’m not populating any default Essbase Scripts yet!):

Essbase Scripts editor in Dodeca 7.3

Pull up the Essbase Scripts management tab by selecting it from the Admin menu

I’ll go ahead and click on New and then choose MDX script. In this case I’ll just call it MajorMarkets_MDX. I’ll then have the following new script properties showing:

Editing a new MDX Essbase script in Dodeca

Editing a new MDX Essbase script

The first thing to do is to define the Query property and populate an MDX script. Editing that property will bring up the following dialog where I can enter the query:

Dodeca MDX script query editor window

Edit the MDX script

For reference (or for copying and pasting with your own copy of Dodeca and Sample/Basic), here’s the MDX script:


SELECT
{} ON 0,
{Intersect(Uda([Market], "Major Market"), [Market].Levels(1).Members)} ON 1

Note a couple of things about this script:

  • I can specify an empty tuple for the first axis (axis 0). A lot of examples of MDX scripts will “anchor” to some default member in another dimension, usually Actual from the Scenario dimension, but in this case it’s not necessary and in fact will keep the script cleaner and reusable
  • I’m not specifying ON PAGES, ON ROWS, ON COLUMNS, or similar. The equivalent to these are AXIS(0), AXIS(1), and AXIS(2), respectively (also note that there are additional axes although in practice it seems uncommon to see more than three, in favor of using CrossJoin). As I also recently discovered, you don’t even need to write out AXIS – using the axis index itself is sufficient
  • There’s no FROM [Sample].[Basic] at the end of the query. It can be included if we want, but when an Essbase connection is specified for the query (as we”ll configure in a moment), the cube is implied and we can save some keystrokes (but perhaps more importantly, we can make our script even more reusable)

With the query now specified, let’s set the Essbase connection (this is a simple dropdown where we choose an already configured connection, in this case, Sample.Basic), and lastly, set the Axis property. We can use Rows here because in this case we only want to return the data as a simple list of rows, because it’s being populated into a simple selector list.

Editing Essbase script properties for MDX script in Dodeca

Set the EssbaseConnectionID and Axis on the Essbase script property editor

With the configuration out of the way, we can now test the query to make sure it brings back the proper data. In the following screenshot, I’ve selected the Show as Member List option, which has the effect of showing the script output as a simple text list (as opposed to inside of a grid). I find that it’s my preferred viewing format for simple selectors like this. Just press Test Query and check things out:

Testing an MDX script in Dodeca's MDX query editor

Test the MDX script to verify its output

As expected (or as hoped, perhaps), the exact members I wanted were returned: just those members from the Market dimension that are at level one and that are also tagged with the UDA “Major Market”.

Create the Essbase MDX Selector List

So far we’ve defined an Essbase MDX script inside of Dodeca, using Dodeca’s brand new MDX script editor (that sports syntax highlighting and autocomplete, to boot!). The Essbase Script object itself is just half of the equation. We can reuse this object anywhere in Dodeca that we can reference an MDX script. As it turns out, we want to use this in a new selector list, which we will now configure. Let’s create the new Selector List:

Creating a new EssbaseMdxQuery Selector List in Dodeca

Create a new MDX-based Selector List

First thing’s first, we give the selector list a unique ID, as we would with any other object. Then, as with any other selector list, we choose the selector that it will be associated with. In this case the selector represents the Market dimension from our cube(s). Next, the selector list type is the new EssbaseMdxQuery selector list object type. Lastly, we choose what type of control (GUI) will be used to show the selector list. In this case I just want a simple flat list to show on the side of the view.

Now we configure the properties for the new selector list. Most of the defaults are fine here, although I’m going to focus on setting two things here: one, I want AutoOpenListBox set to True as a nicety for the user so that the list pops open when the view is opened, and second (and more importantly), I need to select my MDX script object for the MdxScriptID property.

Setting Selector List properties for a new Dodeca Selector List

Set basic properties for the new MDX selector list

Update the View

At this point, the Essbase script and the new selector list are ready to go. To finish things out for this example, though, I’m going to update an existing view to use the new selector instead of the one it was previously configured with. So there’s nothing unique about the following steps with respect to MDX selector lists. Let’s go open the view (Income Statement) to edit the selector configuration:

Editing the SelectorConfiguration for a given view in Dodeca

Open view properties to edit the Selector Configuration

A given selector in Dodeca will often have a default Selector List, but in this case we are going to set a specific selector list to use no matter what the default is. In the following screenshot, I have updated the Selector List property of the 4_Market selector so that it specifically uses the new Sample_Basic_Market_Regions selector list I configured a moment ago.

Dodeca "Configure Selectors" dialog to edit selectors for a view

Update the specific Selector List for the Market selector on our view

After that’s set, I just save the selector configuration, update the view, and am now ready to launch the view:

Refreshed Dodeca view showing updated Market selection based on MDX selector

Viewing and building our updated view, showing the new MDX selector in place

As you can see, the old selector that provided a hierarchy of Markets is now gone, and in its place is the new selector being driven by the MDX query we defined, and only showing me the exact selections that I wanted to see.

Wrapping Up

I hope you found this example useful. As I stated earlier, I am very excited about the newfound energy that is being put into MDX these days – both by Oracle and into Dodeca. It is an incredibly powerful language and numerous use cases abound where it can help provide users with exactly the data they want to see, implemented in a way that will be even more clear and maintainable than previous techniques such as report scripts or member queries. I put together a few other MDX query examples for pulling members that might be useful as well.

Small update to essbasepy

Thanks to a fix contributed by a power-user, the essbasepy library (Python MaxL wrapper for Essbase) has been enhanced slightly to include a fix for previous versions of Essbase. There were cases when the library would work out of the box for 11.1.2.4 but some functions didn’t work as expected with earlier versions due to the way a data structure was changed.

New MDX Examples Page

MDX has been around for many years, but it seems to be enjoying something of a renaissance right now. I think there are various reasons for this. Dodeca has supported MDX in various ways for quite some time, and even dramatically enhances MDX support in its latest 7.3 release, including an MDX editor with advanced syntax highlighting and autocomplete (!), support for member lists generated from MDX queries, and more. I really prefer MDX over report scripts especially when it comes to generating member lists. The equivalent MDX queries always seem a little cleaner and succinct.

To that end, I thought I would start collecting various MDX examples that process dimensions/members in certain ways put them up on a page. There are examples for the Sample/Basic database that show fetching members from a dimension at various levels, with a UDA, sorted forwards/backwards, removing duplicates, and more. It’s nothing earth shattering (considering the super complex things that MDX can achieve) but in the future I foresee MDX being used even more for things like this.