jason w. jones

software from the trenches

Data Input with Dodeca, part 2 – Comments

Yesterday, I kicked off my data input mini-series with Data Input with Dodeca, part 1. I’m going to take that example a small step further and put in comments that a user can edit as they add data input. Yesterday I also mentioned that in terms of data input to Essbase, you have several options, some of which include rolling your own in-house solution, such as with VBA (for the record, I recommend against rolling your own solution). It’s a lot of work.

But maybe you’re thinking: “You know what? Locking and sending isn’t so bad, we have a sheet we use…”. Fair enough. What about comments on the data? This question of comments and commentary comes up again and again – for good reason. It’s incredibly useful in the finance world to provide context to a data point, particularly when that data point appears out of the norm somehow.

Comments are a tentpole feature in Dodeca, and probably one of the biggest features in the product that goes to show its philosophy of being a best of breed tool for planning (with a lowercase P!), reporting, spreadsheets, and the best OLAP engine on the planet. Dodeca has extensive support for allowing commentary on any given cell. Today I’m going to talk about one of the simpler use cases for comments. I’ll do this by extending my example from yesterday so that in addition to allowing the user to input budget values for a given market, the user can now provide comments as well.

Setting up Comments in a View

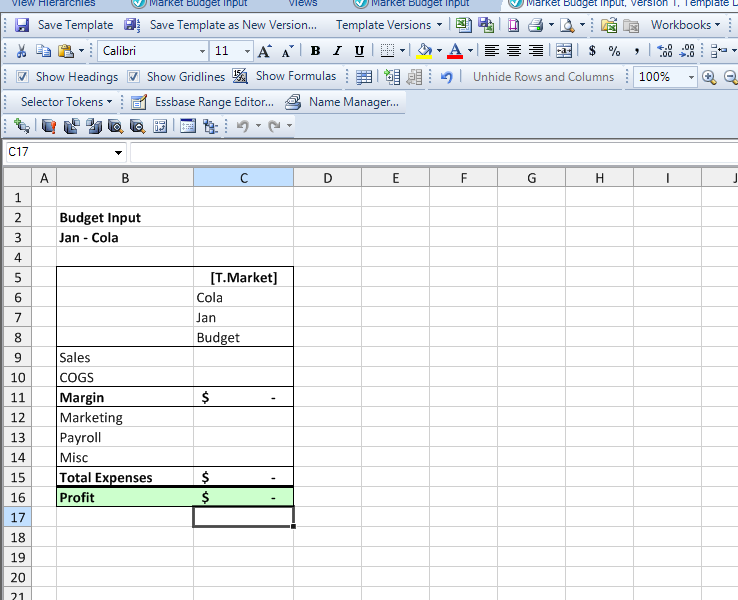
The first thing we need to do is edit our Excel template to add cells for the comments themselves. You can see this in the following screenshot where I have enhanced the data input view from the previous article:
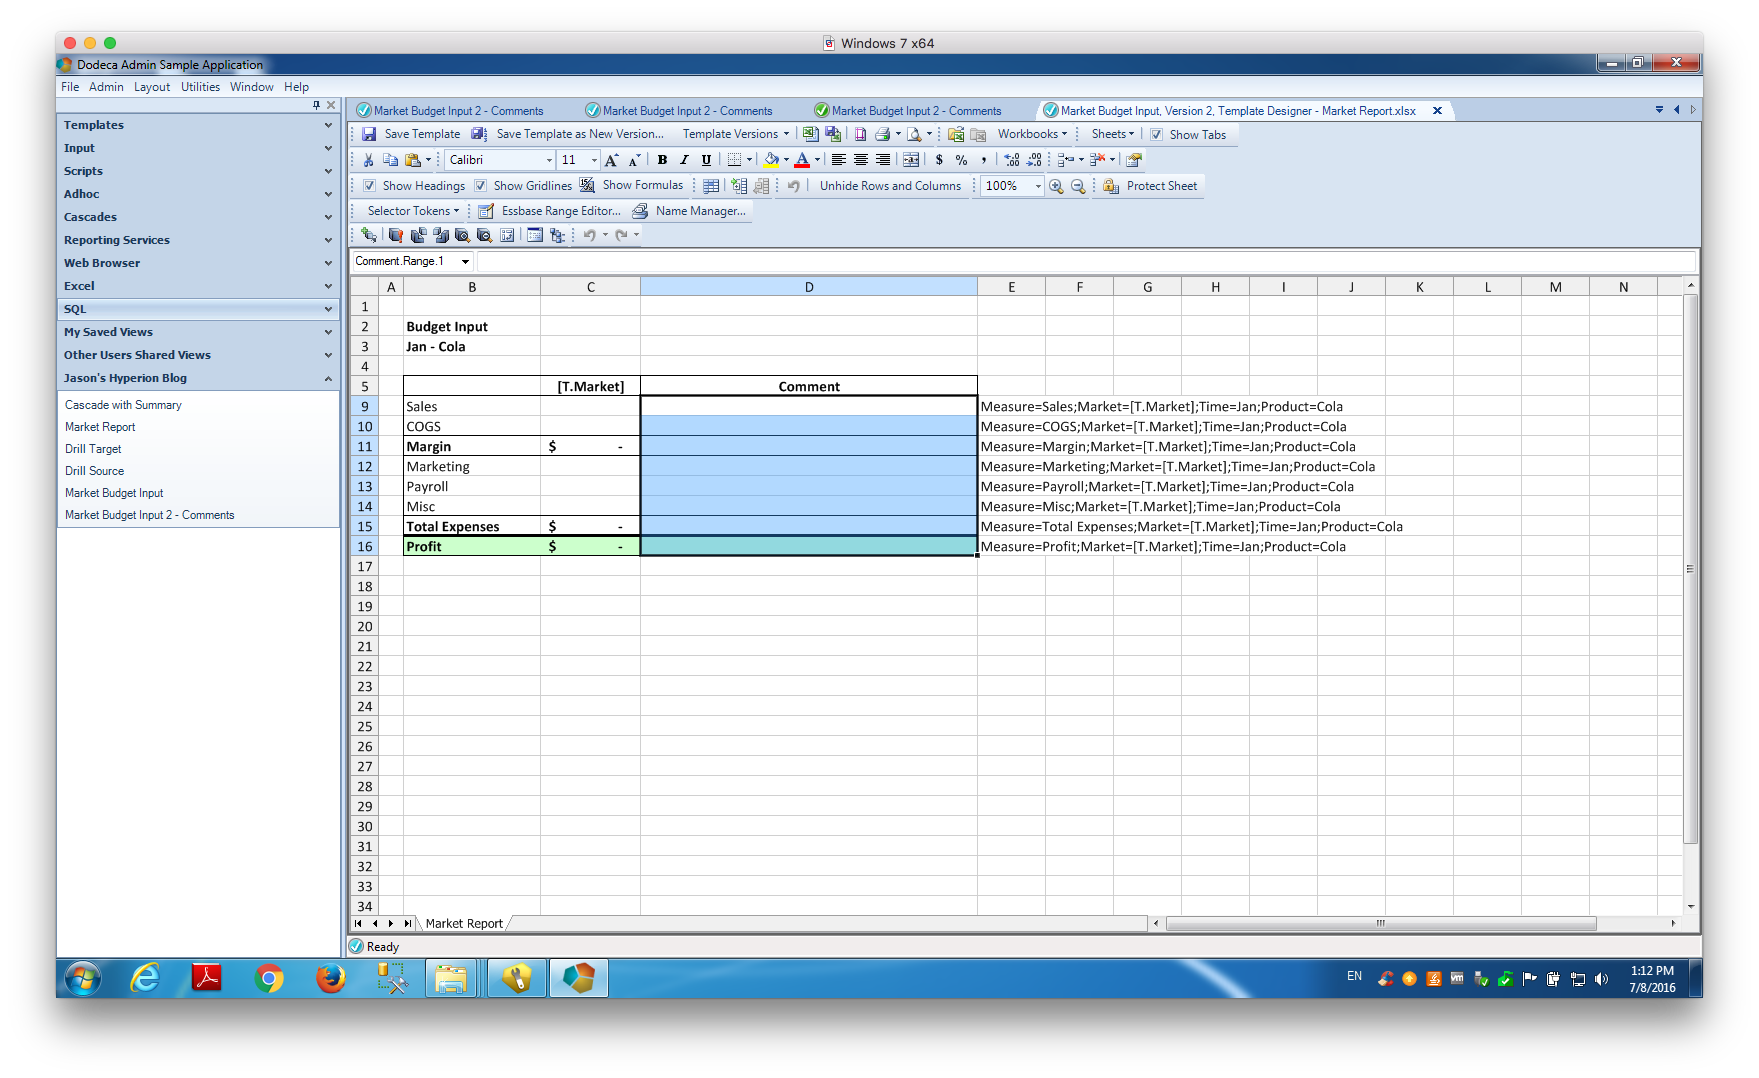
Dodeca input template comment range

Dodeca input template comment range

Note that I have given the comments range a name, in this case Comments.Range.1. This will come into play in a moment when we configure the comments in the view. The next thing that I need to do is define key/value pairs for each comment. Essentially, the key/value pairs are where we use a particular cell to define a unique string of text that identifies a particular comment. As with so many other things in Dodeca, we define this in the cells/workbook itself. The simplest way to achieve this is with a formula that references cells containing members from the point of view (POV).
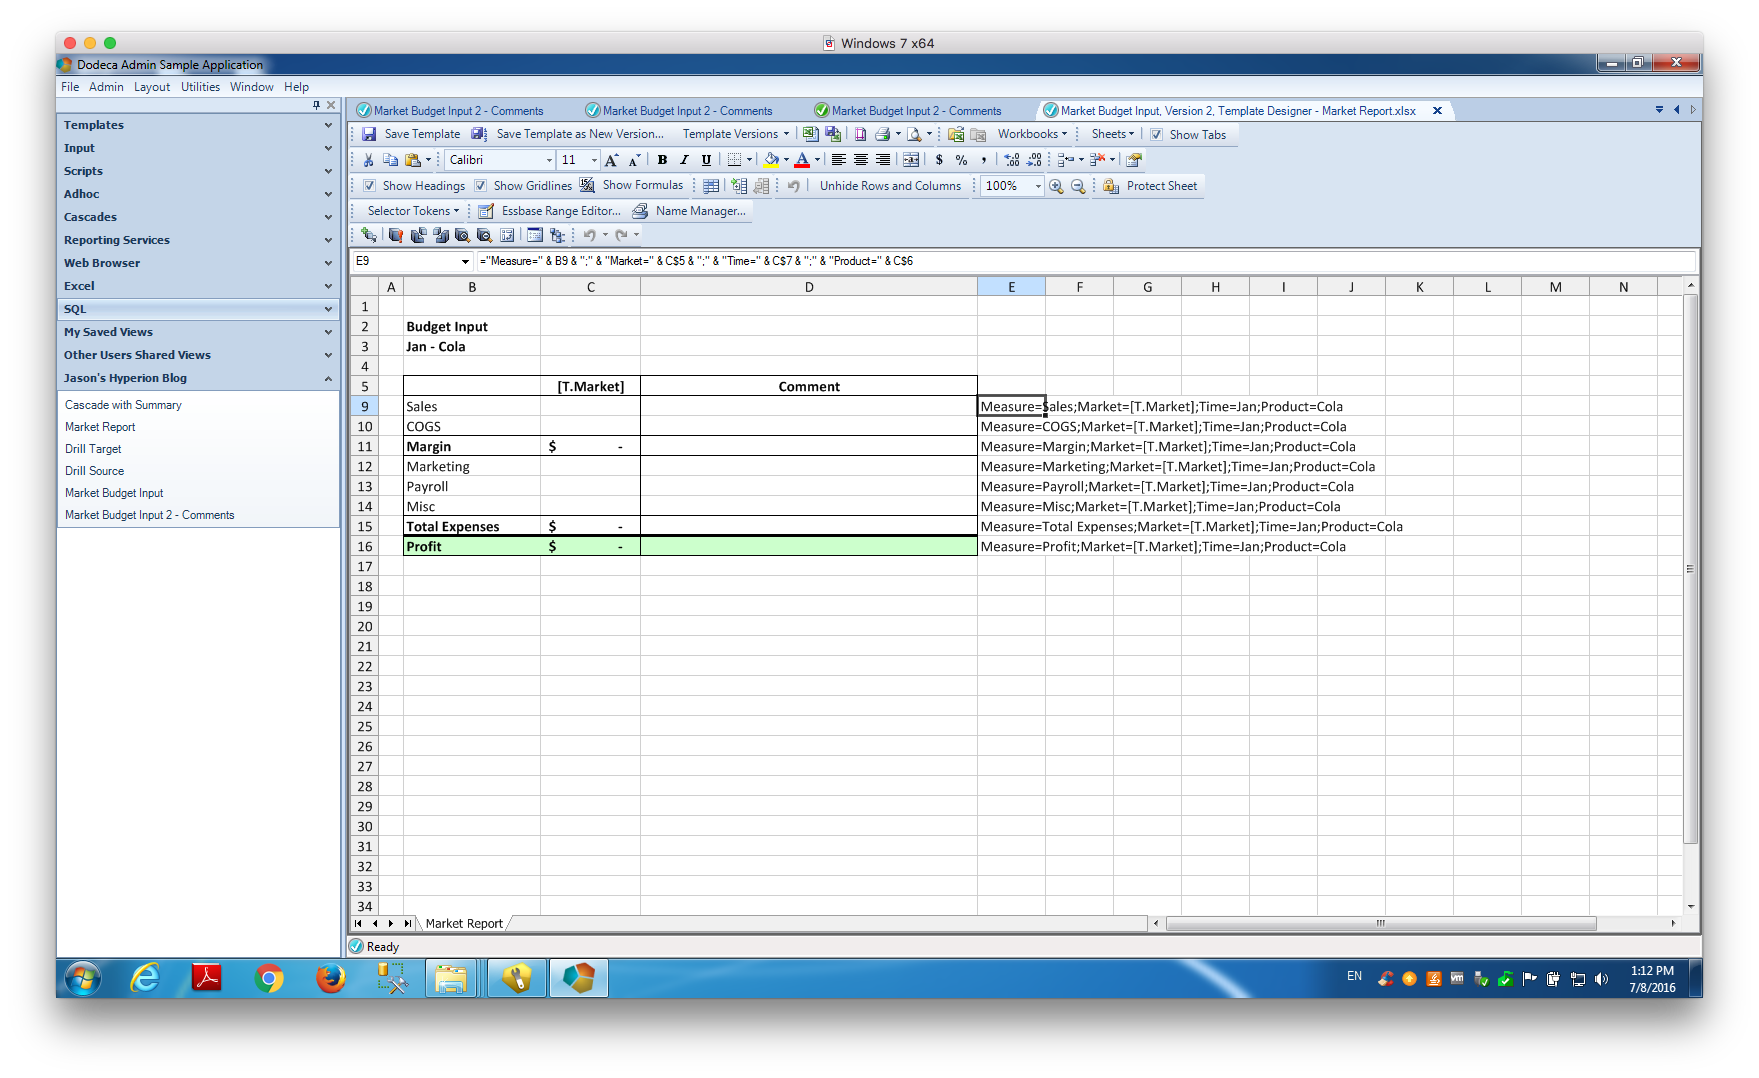
Excel formula showing the key/value associations for a comment

Excel formula showing the key/value associations for a comment

Check out the formula for the comment for the Sales item:

="Measure=" & B9 & ";" & "Market=" & C$5 & ";" & "Time=" & C$7 & ";" & "Product=" & C$6

This is just a normal Excel formula. The format that I want to achieve in this case is that I have a semi-colon delimited list of items that in the format Dimension=Member. So for the first cell, the resulting intersection is this:

Measure=Sales;Market=[T.Market];Time=Jan;Product=Cola

Because it’s just a normal Excel formula, when I fill down, the item for Measure will update based on the current row (after Sales will be COGS). Also note that in this case we just see the token [T.Market]. Remember that with Dodeca templates we often need to think a bit temporally, which is to say that we need to keep in mind that when the view is built by Dodeca, the token will be filled in with the user’s current selection for the Market dimension, and thus the formula and in turn the POV for the comment will be updated dynamically. Also note the absolute cell references in my formula. I want to make sure that when I fill down the correct cell references are maintained.

Before moving on, note just one more thing regarding the POV for our comments: we don’t need to match up with the Essbase dimensions. We typically will match up to some extent, but you don’t have to slavishly represent each dimension. For if there is, for example, a dimension that has no bearing on the comments, we don’t need to bother to represent it.

Since the comment key/value range is only meant for Dodeca to be able to determine what intersection the comments belong to, we don’t really want or need to show it to the user, so we simply hide that column on our sheet, giving us the following template:
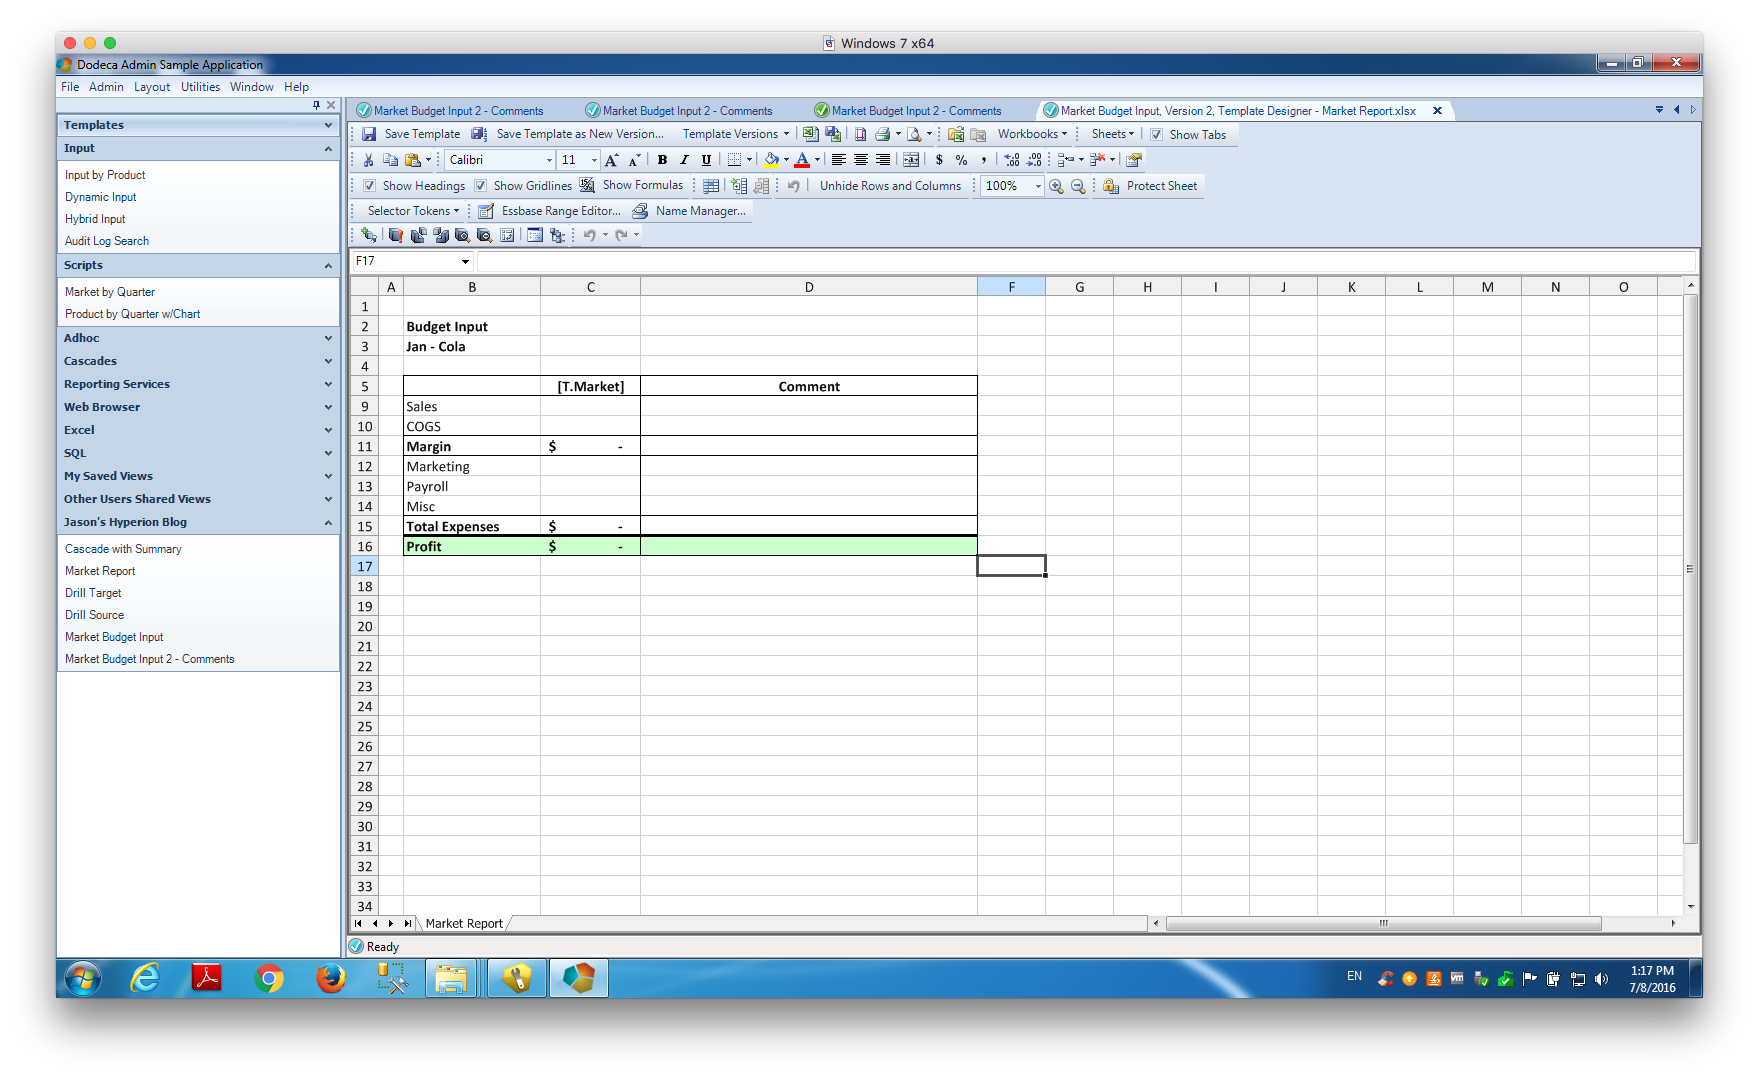
The comment key/value associations are hidden so that users aren't bothered with it

The comment key/value associations are hidden so that users aren’t bothered with it

Now let’s go over to the view properties and tell Dodeca about the comment range in our view, so that it knows how to update and populate them. Under the options for our view, there is a Comments category with several options. In this simple case, we don’t really need to change any of them, except to go in to the CommentRanges item and define a specific comment range (Dodeca allows multiple comment ranges but for now we are just concerned with our one range).
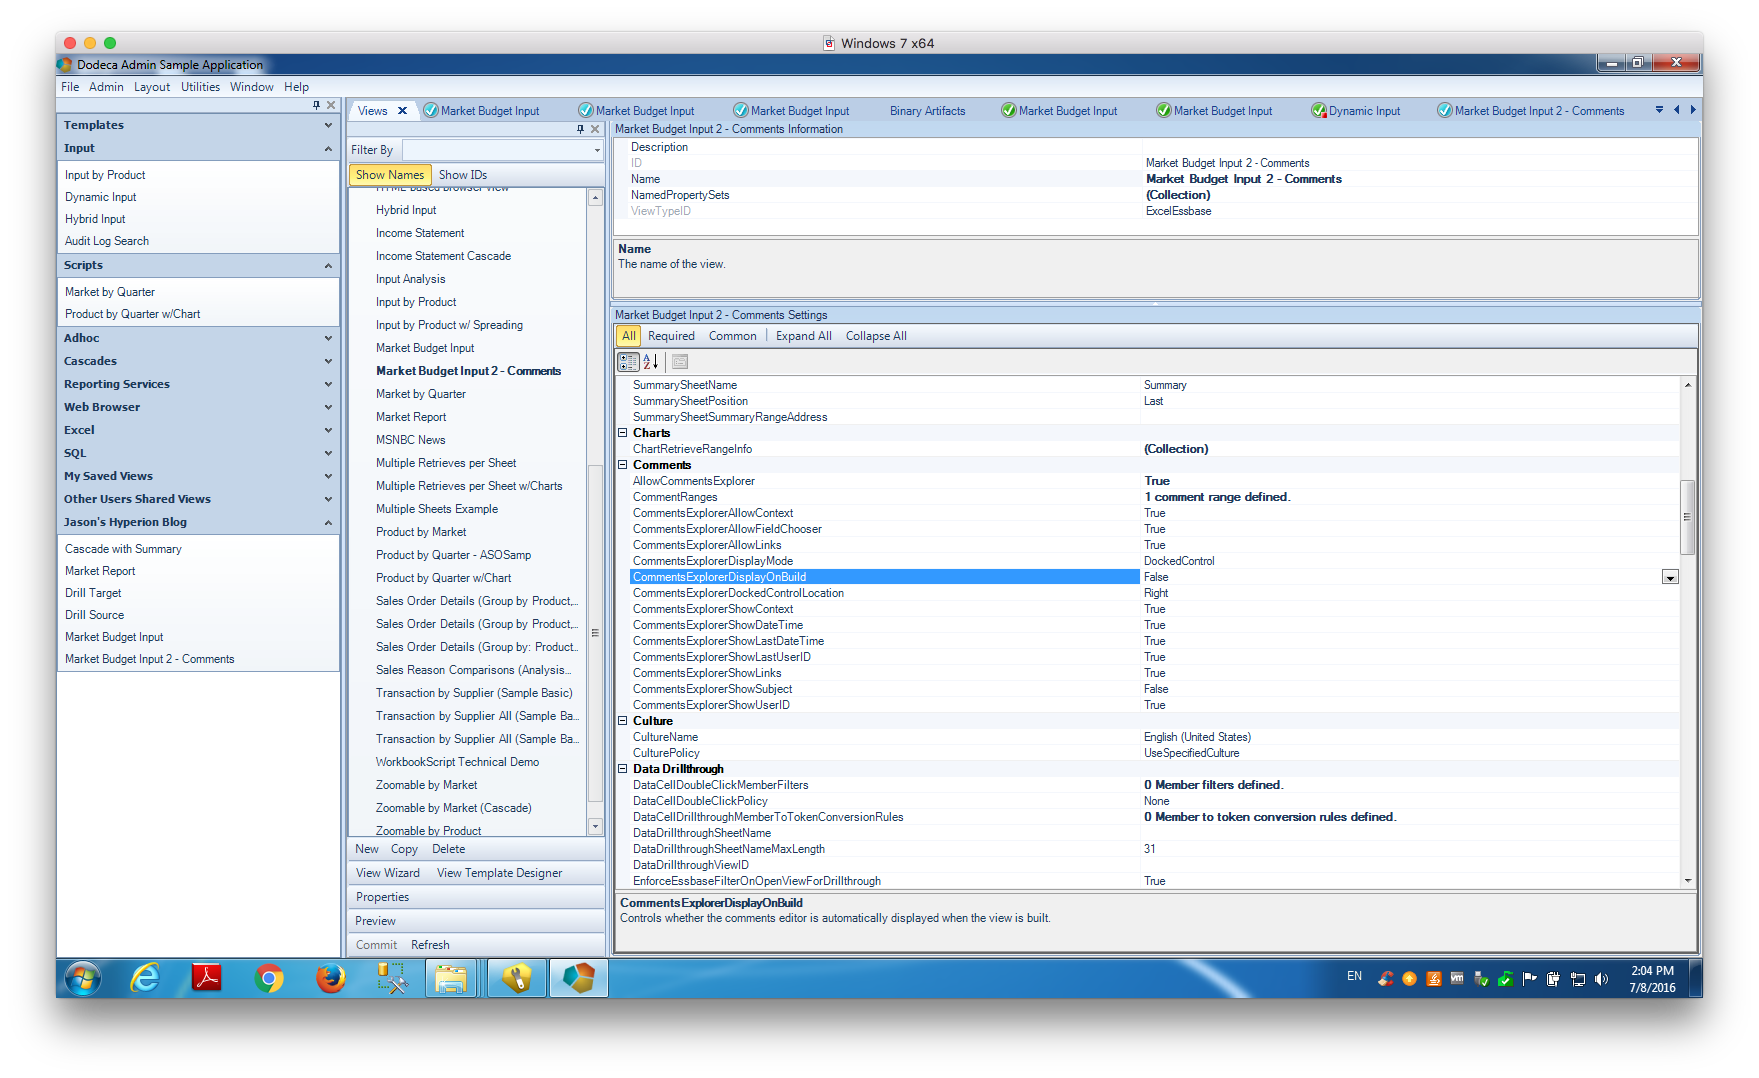
Comments options in Essbase Excel view

Comments options in Essbase Excel view

Let’s take a look at the configuration needed for the comment range that we have been setting up in the template:
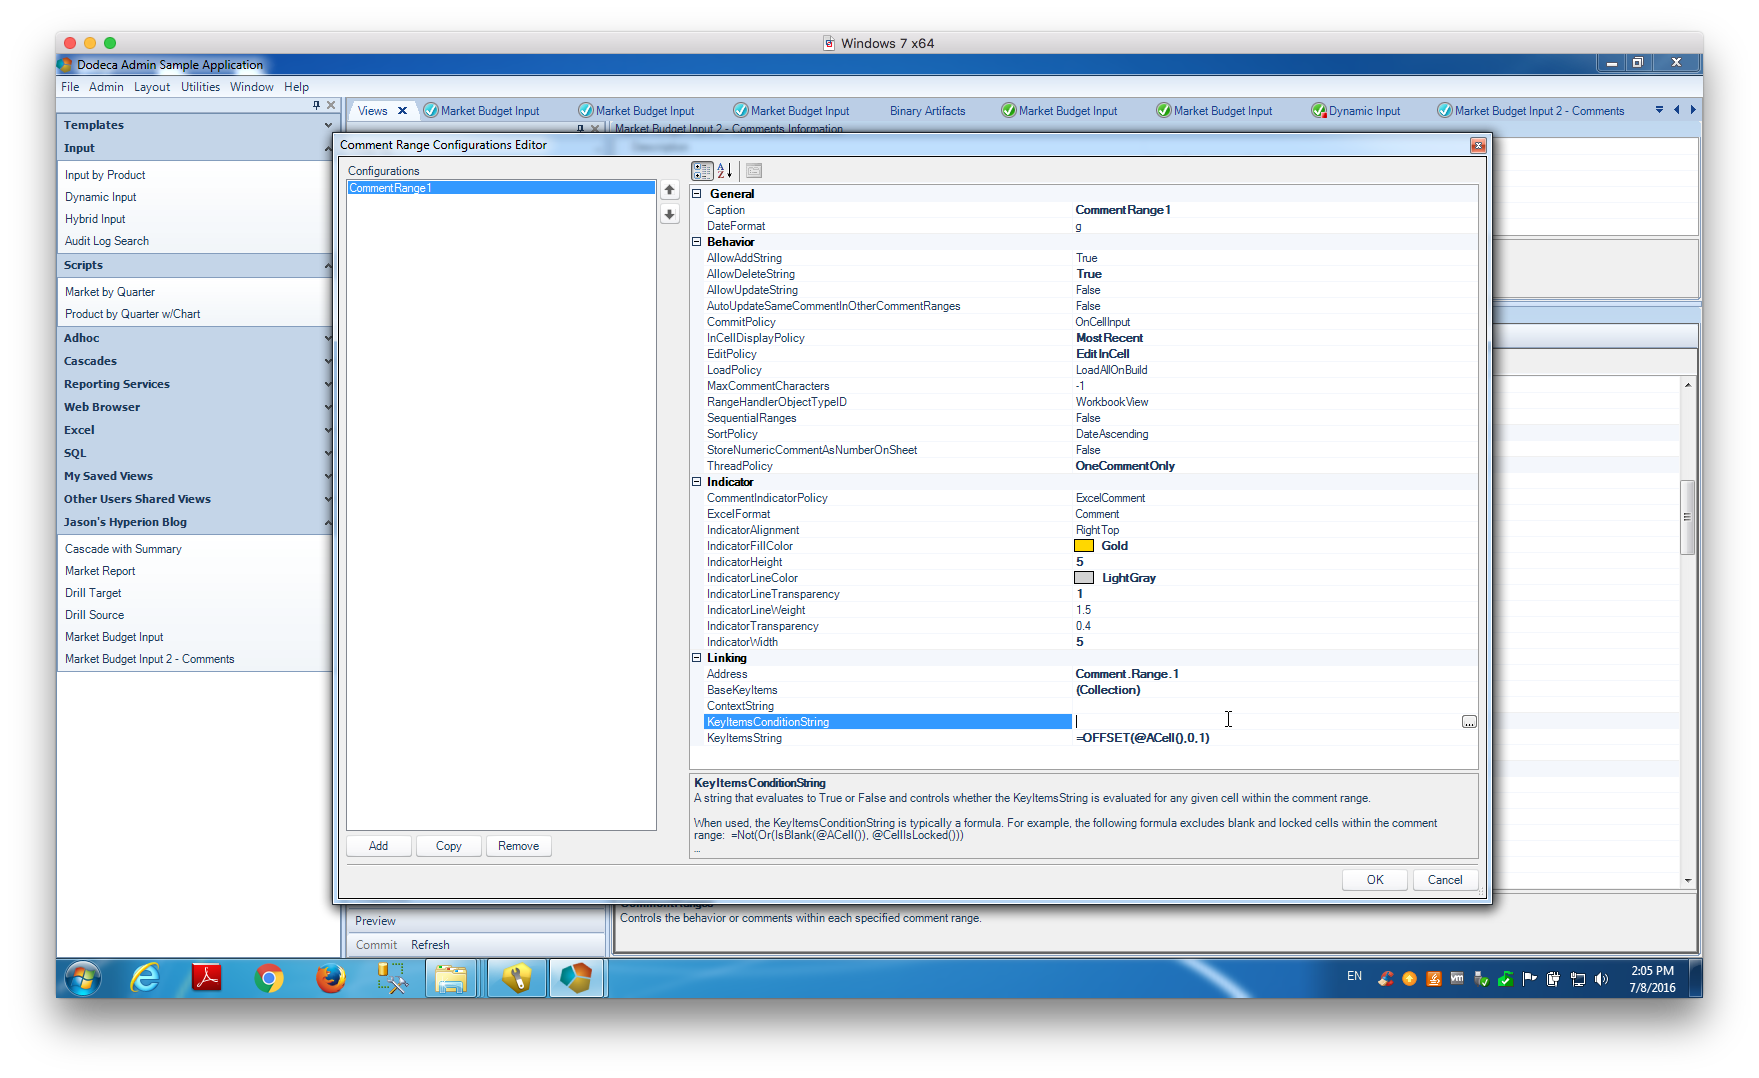
Main comment range configuration for Dodeca input template

Main comment range configuration for Dodeca input template

Dodeca offers an incredible number of variations on the user comment experience and we can control most of that experience. For the moment, only consider the options in bold that I have specifically changed in order to make comments work on this sheet:

  • AllowDeleteString: True. I have specifically told Dodeca that I want to allow users to blank out a comment cell if they so choose, thus erasing the comment
  • InCellDisplayPolicy: MostRecent. Dodeca can track the comments for a given data point over time. In this simple case, I just want to show the most current comment
  • EditPolicy: EditInCell. Dodeca has a more featured comment explorer feature that I will get into in the future. For now we just want to edit the comments themselves in the cell
  • ThreadPolicy: OneCommentOnly. Again, there is quite a bit more enhanced functionality available here but I want to keep it simple
  • Address: Comment.Range.1. This address matches the defined name I have for the comments on the sheet
  • KeyItemsString: =OFFSET(@ACell(), 0, 1). This is probably the “trickiest” element to this entire configuration. In a nutshell, for a given comment range, we need to tell Dodeca about the cells that will contain the comments, and the cells that contain the POV for each comment individually. The formula in this cell represents a combination of an Excel formula along with a special Dodeca function @ACell(). The @ACell function returns the address of the current cell. Using the Excel OFFSET function, we can pass an address and a relative offset. In this case we are saying to offset by zero rows, and offset the column by 1. So this returns the value of the neighbor cell. If for whatever reason our comment POV cells were further to the right (such as one more column over), then I would need to increase this value to match.

Lastly, let’s run the view and see what happens:

The Market Input template as built by the user, with our new comment range

The Market Input template as built by the user, with our new comment range

Now let’s enter some text in to explain the value for Colas:
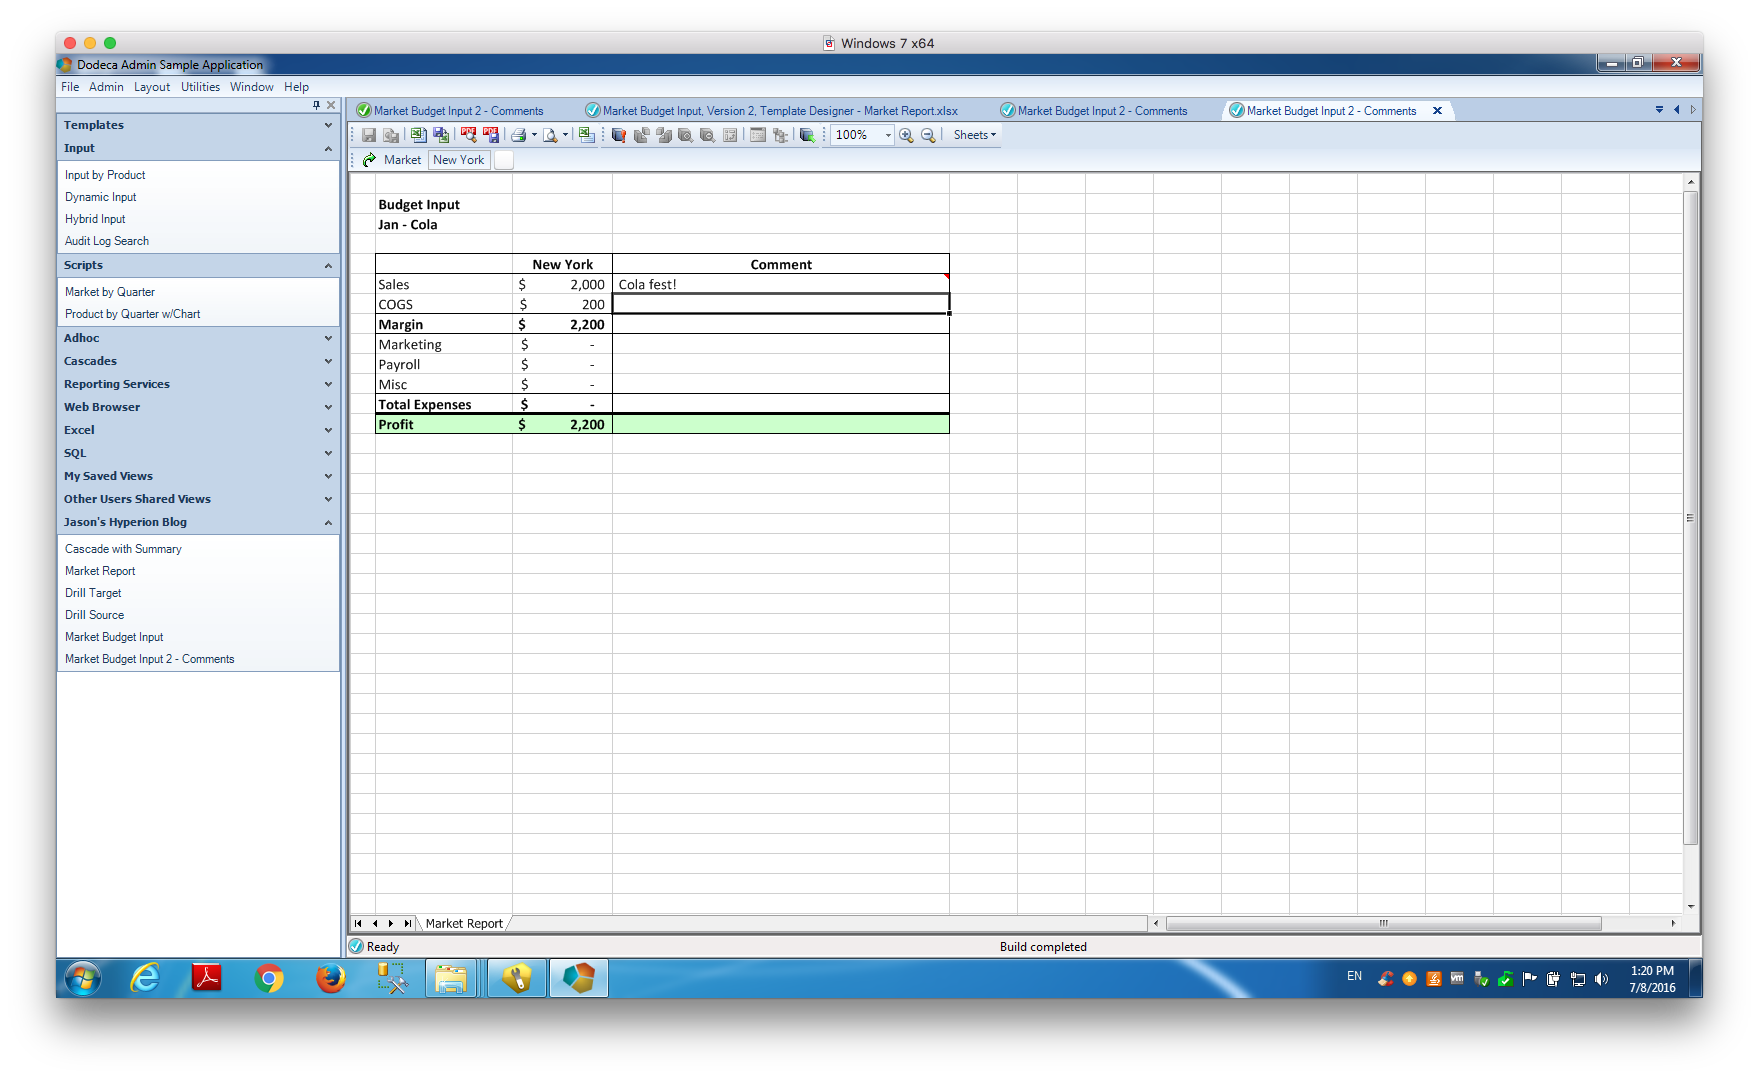
Entering a comment to a cell

Entering a comment to a cell

Given my input policy, the comment is sent up to the database right away. I can close and open this sheet and the comment will be loaded and shown. I can even develop other views and if I plugin the proper comment POV, I can show the comments on a totally different view. The comments are stored in the Dodeca relational repository (not as LROs or otherwise directly in the cube), which gives us fast access to them (and also explains why we don’t need to map every dimension from the cube if we don’t want to).

I hope this brief introduction to the comments functionality in Dodeca was useful and educational. Invariably when people (such as at the Kscope booth) ask about data input, the next question is whether they can get comments too. And the answer is yes; in fact, Dodeca makes it downright easy.
Data Input with Dodeca, part 1

I’m back from Kscope16 (recap coming soon!) and getting back into the swing of things. Needless to say, Kscope16 was another absolutely amazing conference and my three presentations all went pretty smoothly. While at the conference, I got to speak with a lot people about our products, what they do, and how they work. Along those lines, something that came up over and over again in one way or another was that many organizations are performing data input to Essbase using the classic Lock and Send technique or just using the Submit Data button on their Essbase toolbar.
From a purely technical perspective, this can work just fine. From a business perspective, there are numerous pain points. I’ve seen this play out at companies in a handful of ways:

  1. Users have varying levels of Excel/Essbase skill. They are given pre-formatted Excel files and instructed to follow a very specific sequence to enter data into a sheet, connect to the Essbase server, select a range, press submit (or lock, then send), and perhaps run a calculation
  2. Users are asked to fill in a template and email these to a power user or admin so they can properly load it into Essbase using their own template or process
  3. Many hours are spent writing a mini-program in VBA and handing this file out to the users, wherein they are just asked for their username and password, but the automation otherwise hides all of the gory details of connecting and sending data to Essbase.

All three of these situations are rife with complications and things that can go wrong. Off the top of my head, note the following issues in play here:

  1. Varying/extensive amounts of training are required to get users up to speed on how to use Excel, properly format data, and more
  2. The power user/admin is burdened quarterbacking and marshaling significant amounts of data into the cube. This is often a highly paid individual whose time is better spent on other activities, such as development or system improvement
  3. Resist the urge to spend significant amounts of time developing a custom VBA solution. It will always take longer than you think it will and it can quickly become a maintenance nightmare

That all said, one of Dodeca’s core features is the ability to handle data input from users. It excels at this in much the same way that data retrievals work, meaning that we can create an arbitrary spreadsheet to collect input, define what range(s) should be sent up to the server, using any Essbase connection we want, and then optionally performing some action, such as running a calc. For the rest of this post, I’ll be showing a very simple example of this to give you a feel for how this works.

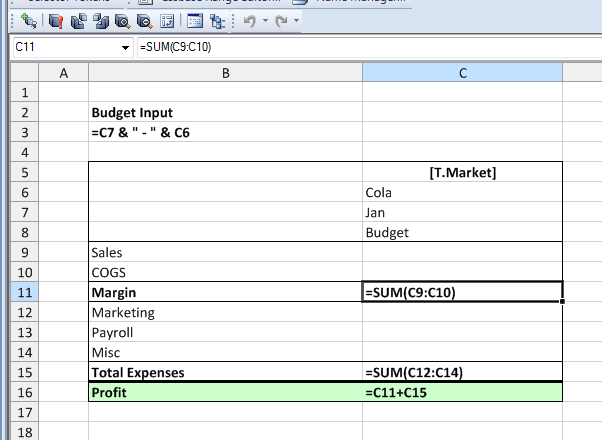
I’m going to modify the simple template that I used for my blog series a couple of weeks ago. This template is based on the Sample/Basic database. In this example, I’m going to fix (hardcode) the product but allow the user to change the Market. This is a bit of a contrived example (normally we’d want the user to budget for multiple time periods) but it will demonstrate the basic functionality. I’ll expand on more complex examples in the near future.

To start things off, let’s take a look at our simple input template:

A simple Dodeca data input view template

A simple Dodeca data input view template

In particular, note that I have used a normal selector [T.Market] to indicate that the market selected by the user should be plugged into the template. So you can think of data input in Dodeca as an elaboration on the normal Dodeca report/retrieve paradigm: we get to use the same spreadsheet/token/selector functionality as before, and simply extend it to send data back up.

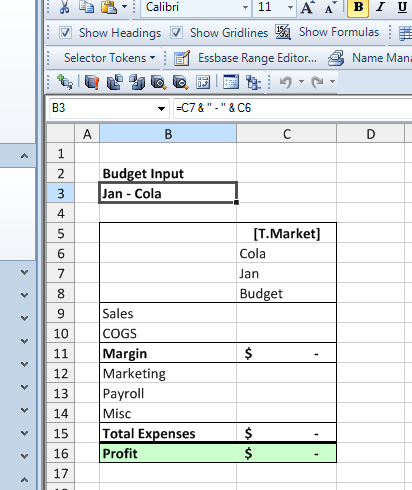
In this particular example just to simplify things a bit, I have chosen to hardcode the product (Cola) and the time period (Jan). In a future example I will make those into tokens. As with before, I have decided that for visual/aesthetic reasons, I would like to take the current product and time period and use those values to put a “nice” title elsewhere in the sheet. This is accomplished with a simple Excel formula to concatenate the values using cell references, as shown here:

Dynamic template title using Excel formula

Dynamic template title using Excel formula

Now, one interesting difference in our input sheet versus our normal report sheet is that we are going to use an Excel formula to calculate data as it’s entered and provide the user some instant feedback on the values they are entering. Consider the following example, noting the formulas for Margin, Total Expenses, and Profit:

Regular Excel formulas dynamically calculate user-input as it is entered

Regular Excel formulas dynamically calculate user-input as it is entered

If we were just creating a normal report of this data (meaning it was a retrieval, not a send), we probably wouldn’t have these formulas here, because the data would be coming directly out of Essbase. In the case of input, however, there is no harm in putting a formula here, and indeed, that’s exactly what we want. Remember, we get to leverage all of the power and expressiveness of Excel in our templates, so we can include just a normal Excel formula in these rollup rows (since the user won’t be entering a value for them anyway), and as the user enters data we can show them the dynamic total. This is a somewhat subtle nicety that I think is worth noting. Among other things, it obviates the need for the user to, say, enter a value, submit it, calculate the cube, retrieve, and see what their running total is. Again, remember, we are looking for that polished and intuitive user experience.

Given the way this template is constructed, we need to let Dodeca know what the range of cells is that contains data to be sent to the cube. This works exactly the same as it does for retrieval ranges, just with a slightly different name. Shown in the following screenshot is the special named range Ess.Send.Range.1 that let’s Dodeca know (in conjunction with our SendPolicy) where the Essbase data range is that should be sent to the cube.

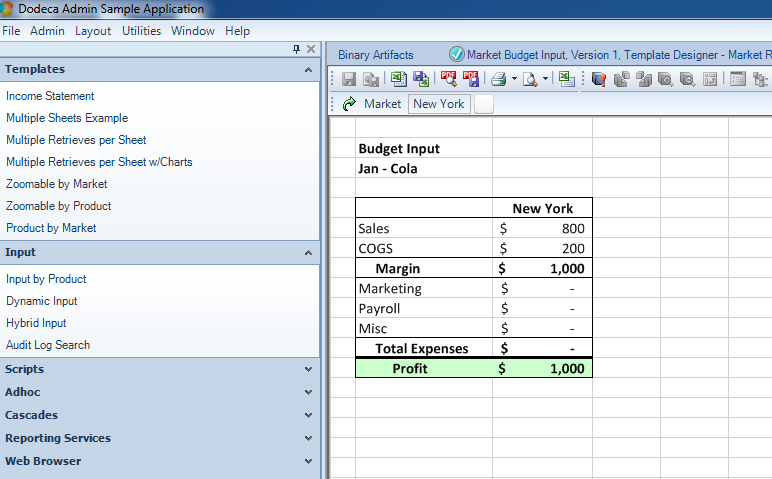
With the template and view saved, I can now run it:

Our built input view showing current values for the Budget for this POV

Our built input view showing current values for the Budget for this POV

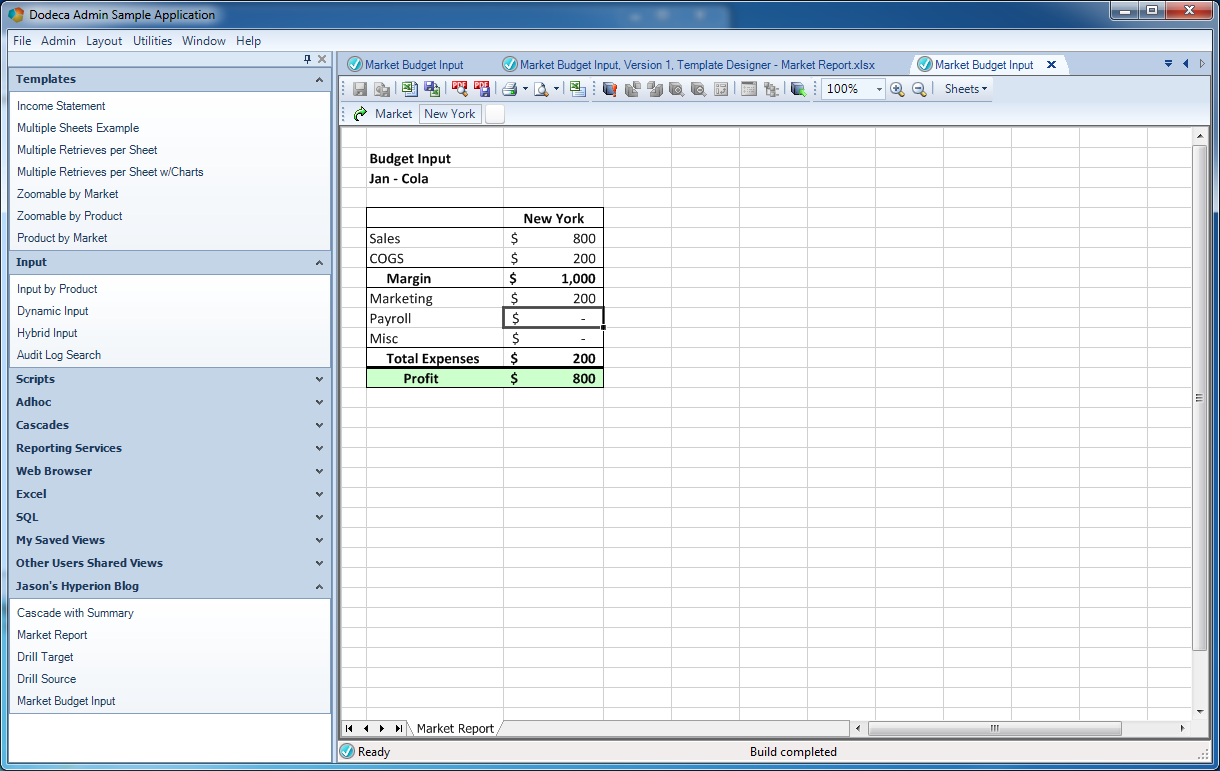
Let’s see what happens when I type in a value for Marketing and hit enter:

Dodeca input view, shown with rest of Dodeca client for context

Dodeca input view, shown with rest of Dodeca client for context

My Expenses value was dynamically updated via its Excel formula, and in turn, my profit value was updated.

Do you see the problem with this data? If you said, “Wait a second, you just increased your expenses but the profit went up, what gives?” – you’d be correct (and astute).

We aren’t limited to just addition or simple sums – again, we can use just about any Excel function that we want. In this case, a better formula to use would be one that subtracts the expenses from the margin and shows the value. I simply go back into my Excel view template, update the formula in cell C16 to actually be =C11-C15, save the template, and re-run it.

Now check out my dynamic totals:

Budget input example with dynamic formula values

Structure with Flexibility

I hope you enjoyed this simple example of user input directly to Essbase that is facilitated by Dodeca. In the coming weeks I’m going to show off some really interesting examples that are more involved, but I definitely wanted to start off with the basics. I think this is incredibly relevant due to the apparently huge number of people I have talked to (especially last week at Kscope) that have a very cumbersome input process fraught with Excel sheets flying back and forth via email, extensive user training, and sometimes performance issues. Even if I was the manager of a relatively small finance team (especially if including non-finance users), I would be looking for a tool that provided me enough structure to make the process streamlined and straightforward, while maintaining flexibility: adapting a process to my business rather than adapting my business to a process (or technology). In this regard, Dodeca delivers.


Multiple Retrieves in Dodeca

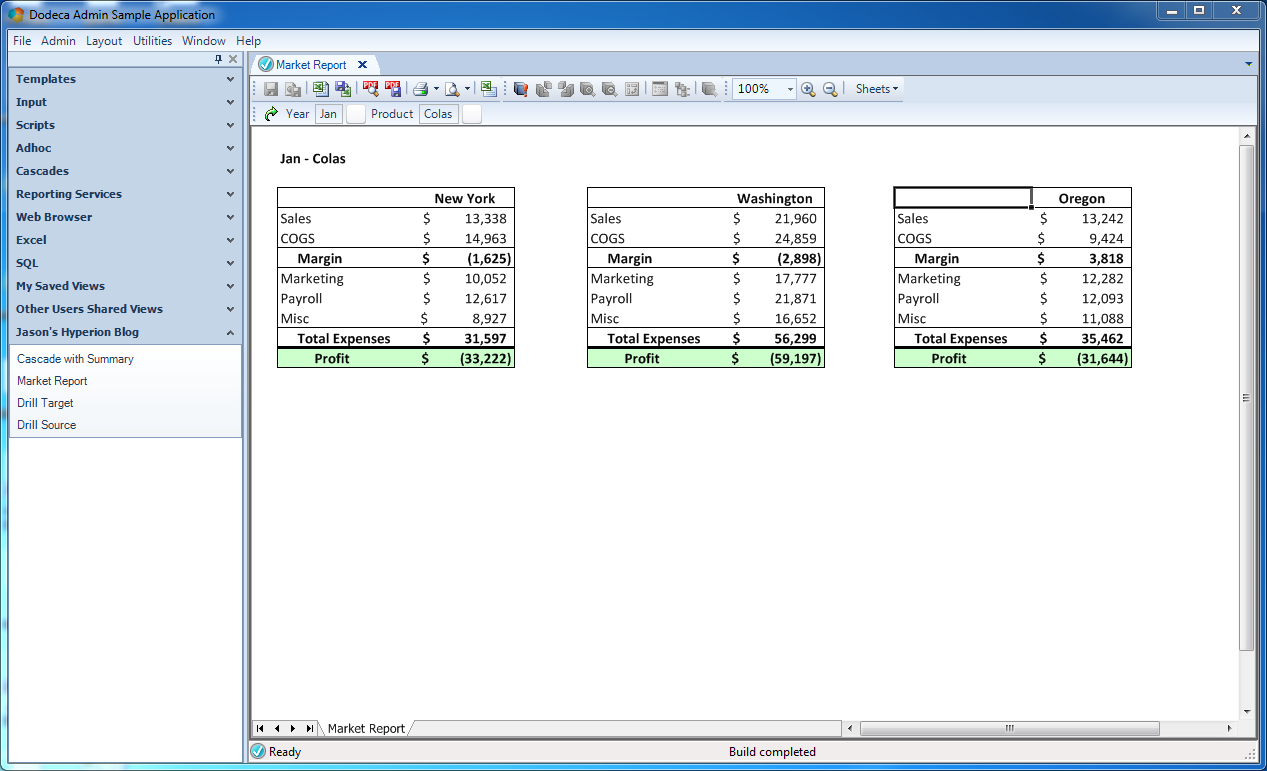
Continuing on in this weeks blog series and lead up to Kscope16, I’m going to show off one of the fundamental concepts in Dodeca with regard to building reports: multiple retrievals in the same sheet. This is a core feature of Dodeca that has been around since its earliest days.

I would guess that the vast majority of spreadsheets built to retrieve Essbase data are just a single retrieve. But quite frequently we want to have a sheet with data from multiple retrieval ranges on it. These other retrieval ranges might be from the same database/cube or from another data source. In a pure Excel environment, the process of updating a sheet with multiple retrieval ranges is straightforward, if a bit tedious: select the first retrieval range, retrieve it, select the second, retrieve it, and so on.

For one or two retrieves, this isn’t so bad. But for a report that is regularly run, has some formatting, and possibly some other tweaks needed, the effort becomes a bit tedious (and time consuming).

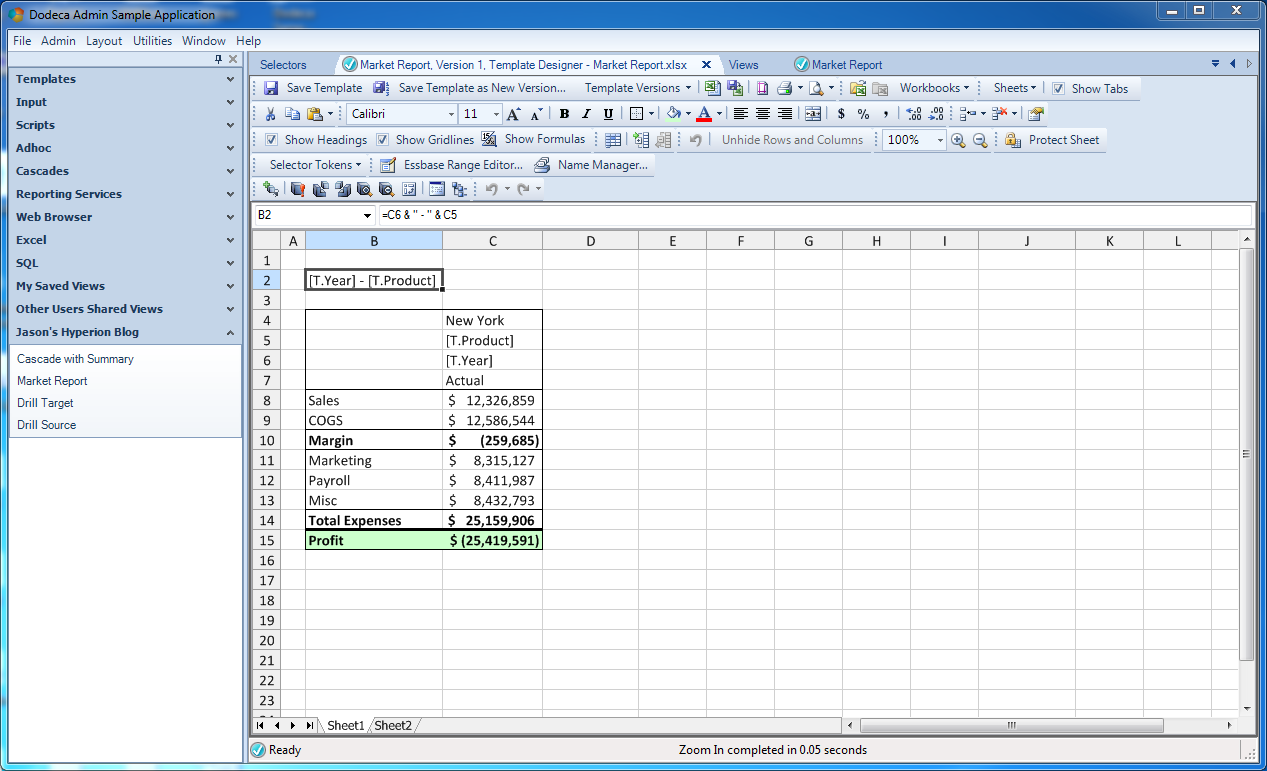
This is where Dodeca’s support for multiple retrieves come into play. We can configure a sheet with absolutely any Excel formatting we want and an arbitrary number of retrieval ranges. For example, consider our good ole friend Sample/Basic. We’d like to setup a report that shows measures for a given product and year for various markets. We can setup a simple Dodeca template like this:

dodeca-multi-retrieve-01-template

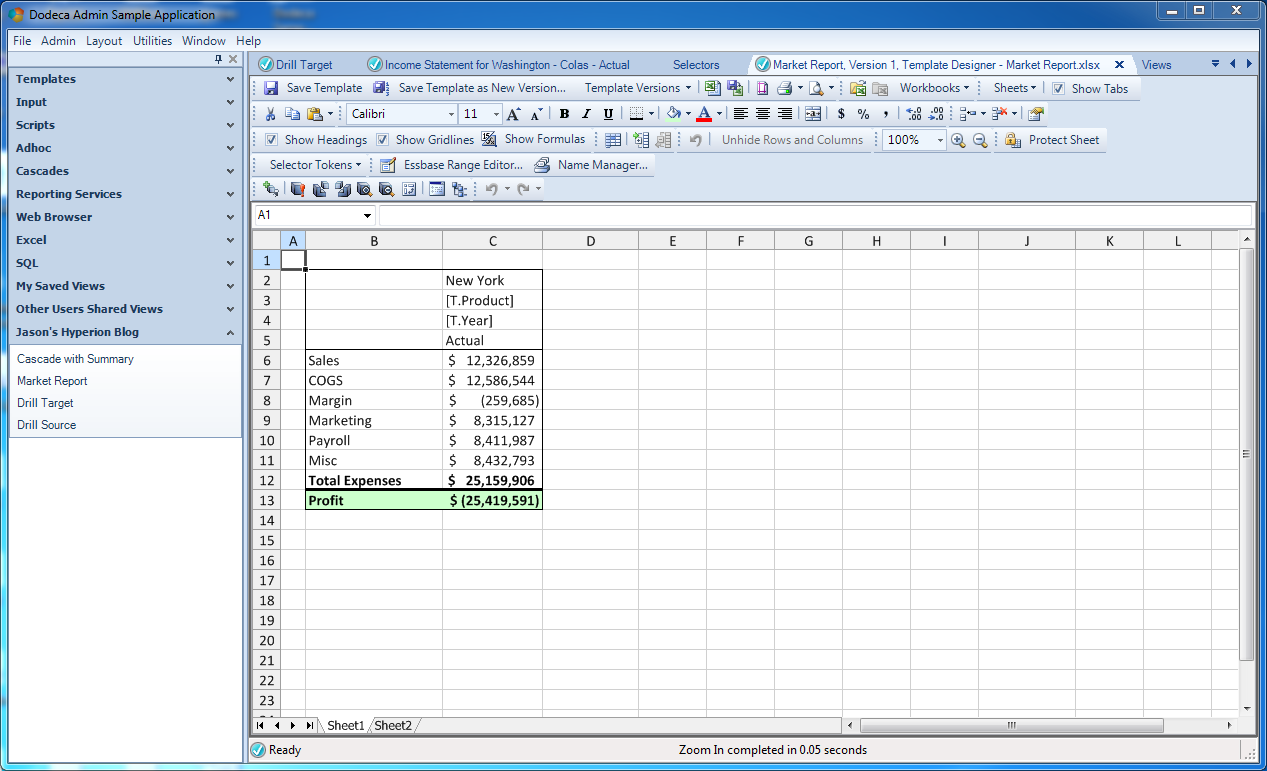
There’s nothing too fancy just yet. Take note of how the Year (time period) and Product are tokenized with [T.Product] and [T.Year]. As with before, this means that the selection(s) from the user will be plugged in for these tokens and then a normal Essbase retrieve will be performed.

The plan here is that we’re going to actually have multiple boxes like this on our sheet for all sorts of different markets. That said, we don’t really need to show the time period and product in every single box, since they will be the same for each box on the sheet. So it’s a good candidate to show at the top of the page. So let’s do that:

dodeca-multi-retrieve-02-template-title

Note the formula in cell B2: it’s referencing cells C6 and C5. Sometimes Dodeca forces us to think temporally with regard to how we construct our spreadsheets: during template development, we just see the token names. But remember, when the sheet gets built, the token will be replaced with the value of the selector (in this case), and the value shown in our title will update because it’s dynamic. This is an incredibly foundational element in Dodeca templates. We can use any Excel formula too: so if we need to trim a string, concatenate, or whatever, that’s all in our toolbox.

As a quick aside, things like this (with formulas) tend to be one of the reasons that Dodeca resonates so strongly with users and power users in finance at various organizations: because an incredible amount of existing Excel knowledge is directly applicable and useful. It shortens the learning curve. A lot.

Now that we have a basic format our our “measures box” that we like, we can simply copy and paste it to create additional boxes with a fixed market. Remember, while the user can choose the product and time period for this report, we’re going to give them a fixed list of markets for now. As you can see in the screenshot, I have updated the Market to Oregon and Washington in the new boxes. Additionally, I have hidden the time period and product from each box (since the boxes are all aligned I just wound up hiding two rows and that affected each box). Even though the rows are hidden, they will still be part of the retrieval range. Speaking of retrieval ranges, we have three of them now: named ranges that correspond to the retrieval to be performed for each data box.

dodeca-multi-retrieve-03-built

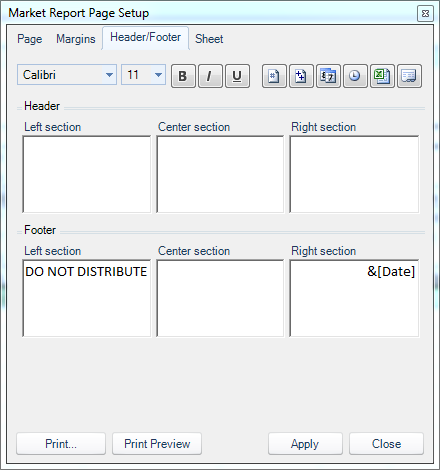
Just for fun, and to continue on with the theme of “your Excel knowledge is applicable and useful”, let’s adjust the page footer a little bit, using the common page header/footer editing dialog box, and place in the current date in the lower right corner and a note about confidentiality in the lower left:

dodeca-multi-retrieve-04-footer-configuration

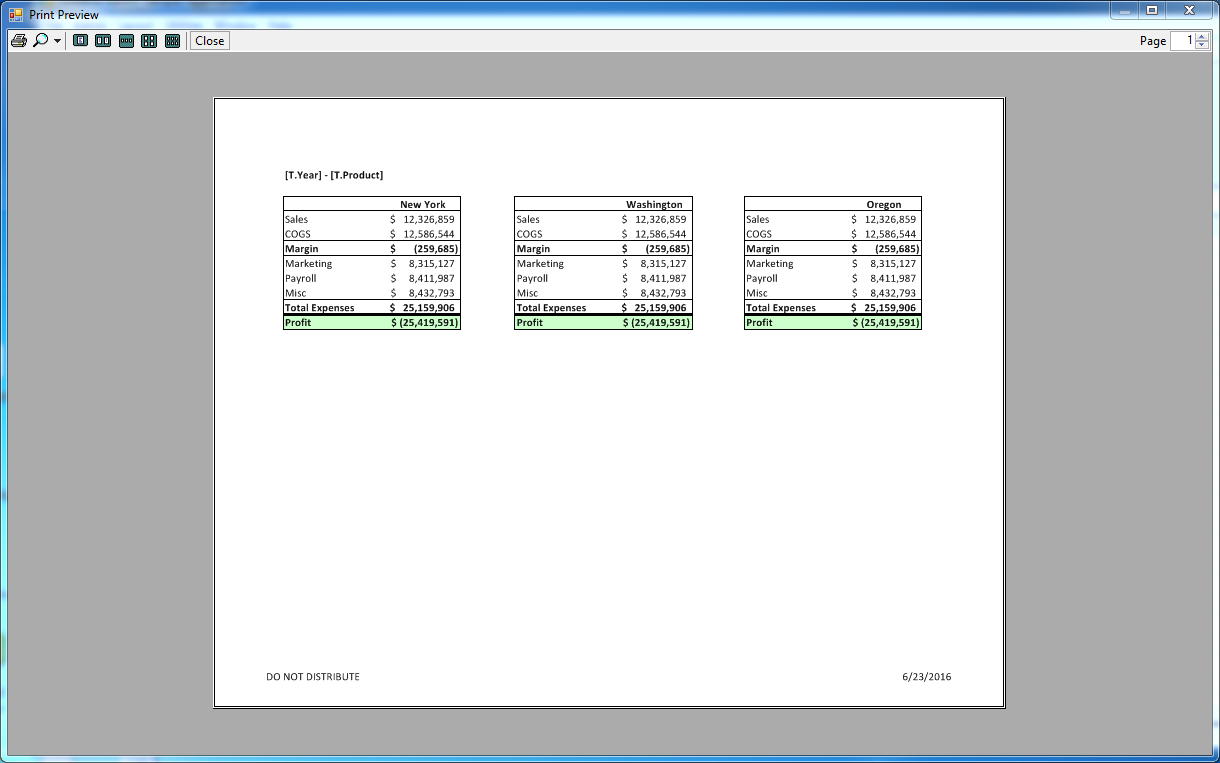
Lastly, I’ll adjust the print range, page orientation, and do a print preview to see what this report is going to look like when it’s printed out:

dodeca-multi-retrieve-05-print-preview

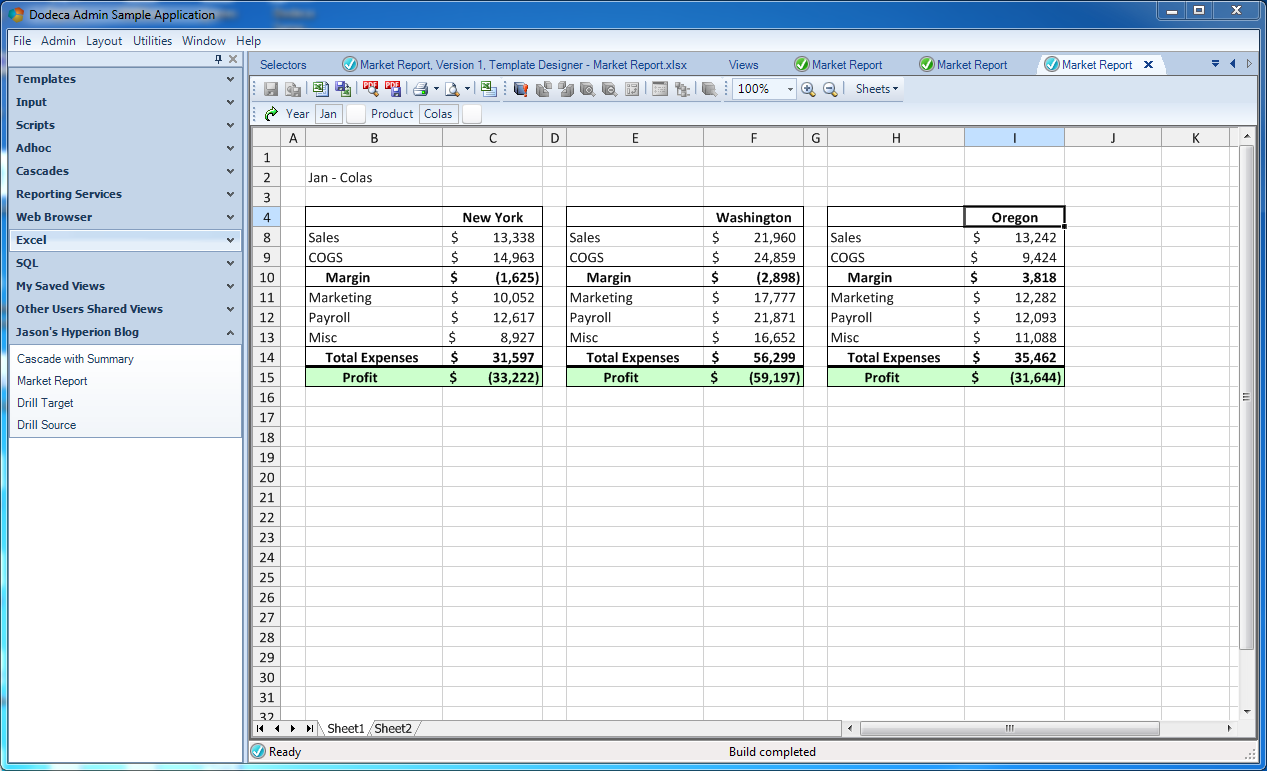
Not shown here, but I also went into the options and turned off row/column headers and gridlines to clean the appearance of the report up a little bit. These are just easily toggled with a simple option. Everything is looking good. Now let’s run the view, select a product and time period, and build it:

dodeca-multi-retrieve-06-cleaned-up

And there we have it: a nicely formatted report that users can build with any product and time period, at the click of a button, and get nice print-quality output if they want a hardcopy. I want to recap some of the fun things going on here:

  1. Multiple retrieval ranges: use the infinite flexibility of Excel to arrange data exactly how you want it, not some arbitrarily limited data arrangement
  2. Use Excel formulas (and our existing Excel knowledge) to format the report exactly how we want, dynamically
  3. Instantly build at the press of a button: no connections, selections, individual retrievals, row hiding, or formatting to deal with
  4. Printer-ready output if we want a hard copy
  5. No off-by-one errors or other innocent mistakes involved in the process of generating the report: get the right data, every time

In the coming weeks I’ll show off some more advanced examples that combine multiple data sources, multiple types of data sources (SQL data anyone?), and more. Stay tuned and don’t forget to swing by the Applied OLAP booth at Kscope and say hello!

Cascading Report Summary Sheets in Dodeca

Earlier this week I looked at setting up report cascading with Dodeca. With that foundation in mind, today I’d like to look at elaborating on it a little bit by adding on a summary sheet with Dodeca’s built-in summary sheet functionality.

What is a Summary Sheet?

A summary sheet is a sheet in our workbook that is derived from the other sheets generated from a report cascade. For example, let’s say that in my earlier cascade example, I chose two products and two markets: Colas and Diet Colas as my products, and Washington and Oregon as my markets. This would result in four sheets/tabs being generated. Now, what Dodeca allows me to do pretty easily is turn on a summary sheet, which will automatically generate a tab for me (this will be a fifth tab in this example), and contain formulas I designate that will sum up the sheets generated from the cascade.

This is really useful for a couple of reasons. Now, in a perfect world, you’d be able to get summary data from the outline itself, for example, a parent rollup in the Product, Market, and Time dimensions. That’s the whole point of Essbase, right? But sometimes we need arbitrary groupings of things. Frequently this is accomplished with alternate hierarchies. But what if we want the user to be able to create a report with a summary value that is neither in the primary hierarchy nor any alternate hierarchies?

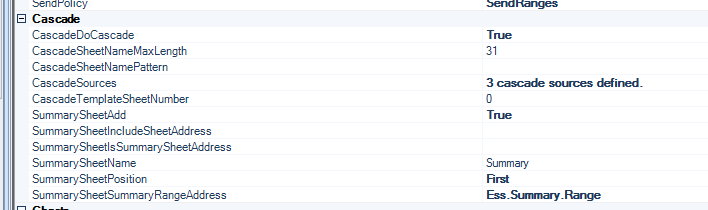
One way we can provide this functionality to our users is to turn on a summary sheet. Here’s a look at the summary sheet options, they are located under the Cascade option group on our Essbase Excel view:

dodeca-summary-sheet-01-options

In particular, note that SummarySheetAdd is set to True. Additionally, I have specified a name for the sheet (SummarySheetName = Summary), specified a SummarySheetPosition (I can have my sheet be the first or the last sheet), and a range of cells to summarize (SummarySheetSummaryRangeAddress). Per best practices, I have created a defined name in my workbook so that I can refer to it easily. Additionally, if I adjust the rows and columns in my template, I don’t need to come back to these options and worry about updating some arbitrary range name.

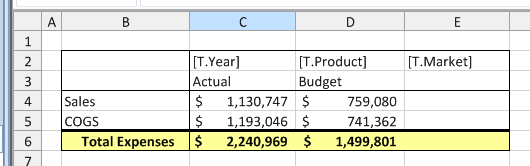
Let’s go take a look at the simple source template:

dodeca-summary-sheet-02-template

As you can see in the template, I have defined a fairly bread and butter Dodeca Excel template, where I have tokenized the Year, Product, and Market, meaning that users will be able to make choices from the selectors and build the report with whatever data they want.

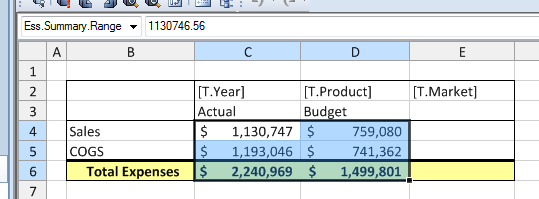
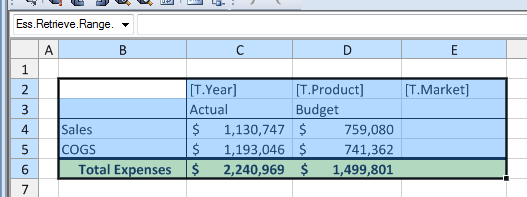
Remember the summary range I mentioned earlier? Here it is, highlighted, showing the cell ranges that will be added up on the summary tab:

dodeca-summary-sheet-03-defined-name

Just for completeness, check out the retrieval range that will be refreshed when the view is built:

dodeca-summary-sheet-04-retrieve-range

Remember, Dodeca can do multiple retrievals in a single sheet and from multiple, disparate data sources. In this case we just have a simple retrieve from the classic Sample/Basic app, but this could just as easily be relational data from SQL Server, Oracle, or all of the above.

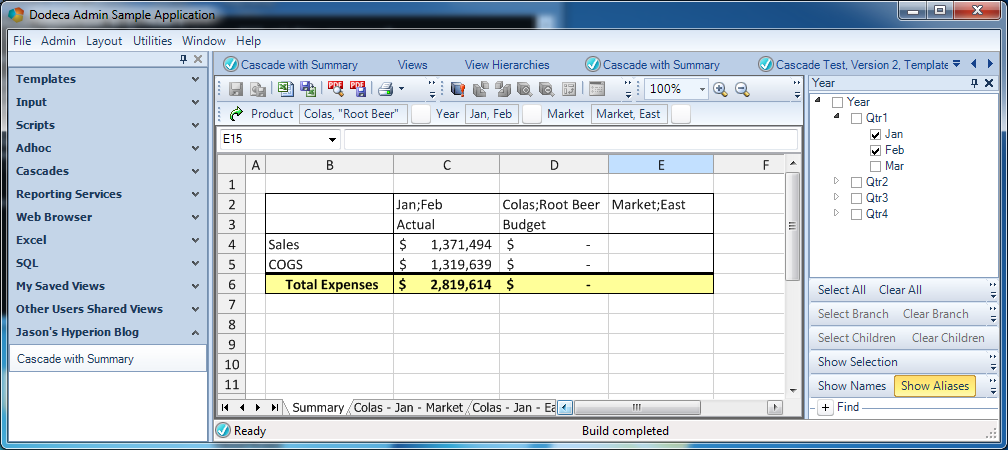
Lastly, having made selections from multiple dimensions, let’s build the view and check out our new summary sheet. Note the Summary tab that appears first, just as we wanted:

dodeca-summary-sheet-05-built-summary

There we have it: with just a few additional options to configure, I have a nice, dynamic summary sheet in this book that users can easily use. What’s even more interesting, is that I gave a user the ability to dynamically sum up data that doesn’t have a member or alternate hierarchy to do the math for me. In this case, it’s the arbitrary sum of Colas and Root Beer for January and February.

Saving Everyone Time

Not to belabor the point, but I think this example shows off some really interesting ways that we provided flexibility to the user and saved the user and administrator time. Without such dynamic summing capabilities, our user might have resorted to pulling data down to Excel and summing things up by hand/formulas, or otherwise going out of their way to get to data that wasn’t directly in the cube. As a one off it’s not so bad, but if it’s a way of common way of seeing the data, then you are potentially saving yourself a minute here and a minute there on a repeated basis.

Our administrator saved time because this might represent an alternate member/group that would be nice to have in the outline but not necessary to have. And in today’s complex metadata management world, that might just represent time not spent marshaling a member request through a byzantine approval process.

In Summary (Pun Intended)

Summary sheets are a very easy to utilize feature in the Dodeca Spreadsheet Management System and can offer your users a convenient way of looking at data that might otherwise be inconvenient (or worse, error prone!) to look at. As with so many other Dodeca features, they can quickly add value to an existing solution and provide your users with that little bit of extra utility that takes your overall solution from good to great.

PBJ PBCS Client GitHub repository

For those of you wanting to play with PBJ, the full code-base is available over on GitHub in the PBJ repository. Just to be clear, this is for people that want or need to edit, view, or make contributions back to the code. You don’t need to do anything with Git/GitHub if you just want to consume the library out of Maven or otherwise include the JAR file in your projects.

That said, there are a few things missing from the library that are available in the PBCS REST API, such as some items having to do with Planning Units, and some new REST API methods that are going to be available soon (having to do with data slices). But in the meantime, enjoy!

Advanced integration with PBJ Java PBCS REST API library

This week’s blog posts are all about the upcoming Kscope16 conference and relate to the presentations I’m part of. This year I am co-presenting with Cameron Lackpour on on-premise Planning versus PBCS and talking about some different use cases. My particular focus for this presentation is how you might use the PBCS REST API with Java.

Over the last year I have put together a Java library that works with the PBCS REST API. It has the following characteristics:

  • Open Source (Apache Software License version 2.0)
  • Doesn’t depend on any Oracle libraries or code
  • High-quality, readable, fluent API

In my opinion, all of these goals have been met. Additionally, as of today, PBJ (PBCS Java Client) is available in Maven Central. What this means is that if you or your team programs in Java and use Maven for dependency management, you are just a few clicks away from being able to use this library.

For an overview of why you might want to use PBJ and how it compares to other scripting languages you might want to use instead (such as Groovy, Python, and more), come check out the presentation!

Today, however, I want to show how easy it is to incorporate PBJ into a Java program and do something quasi-practical. So the rest of this article will be oriented towards programmers, but for those of you that have employees or teammates that would be more likely to do the programming aspects of things, keep them in mind and send them a link.

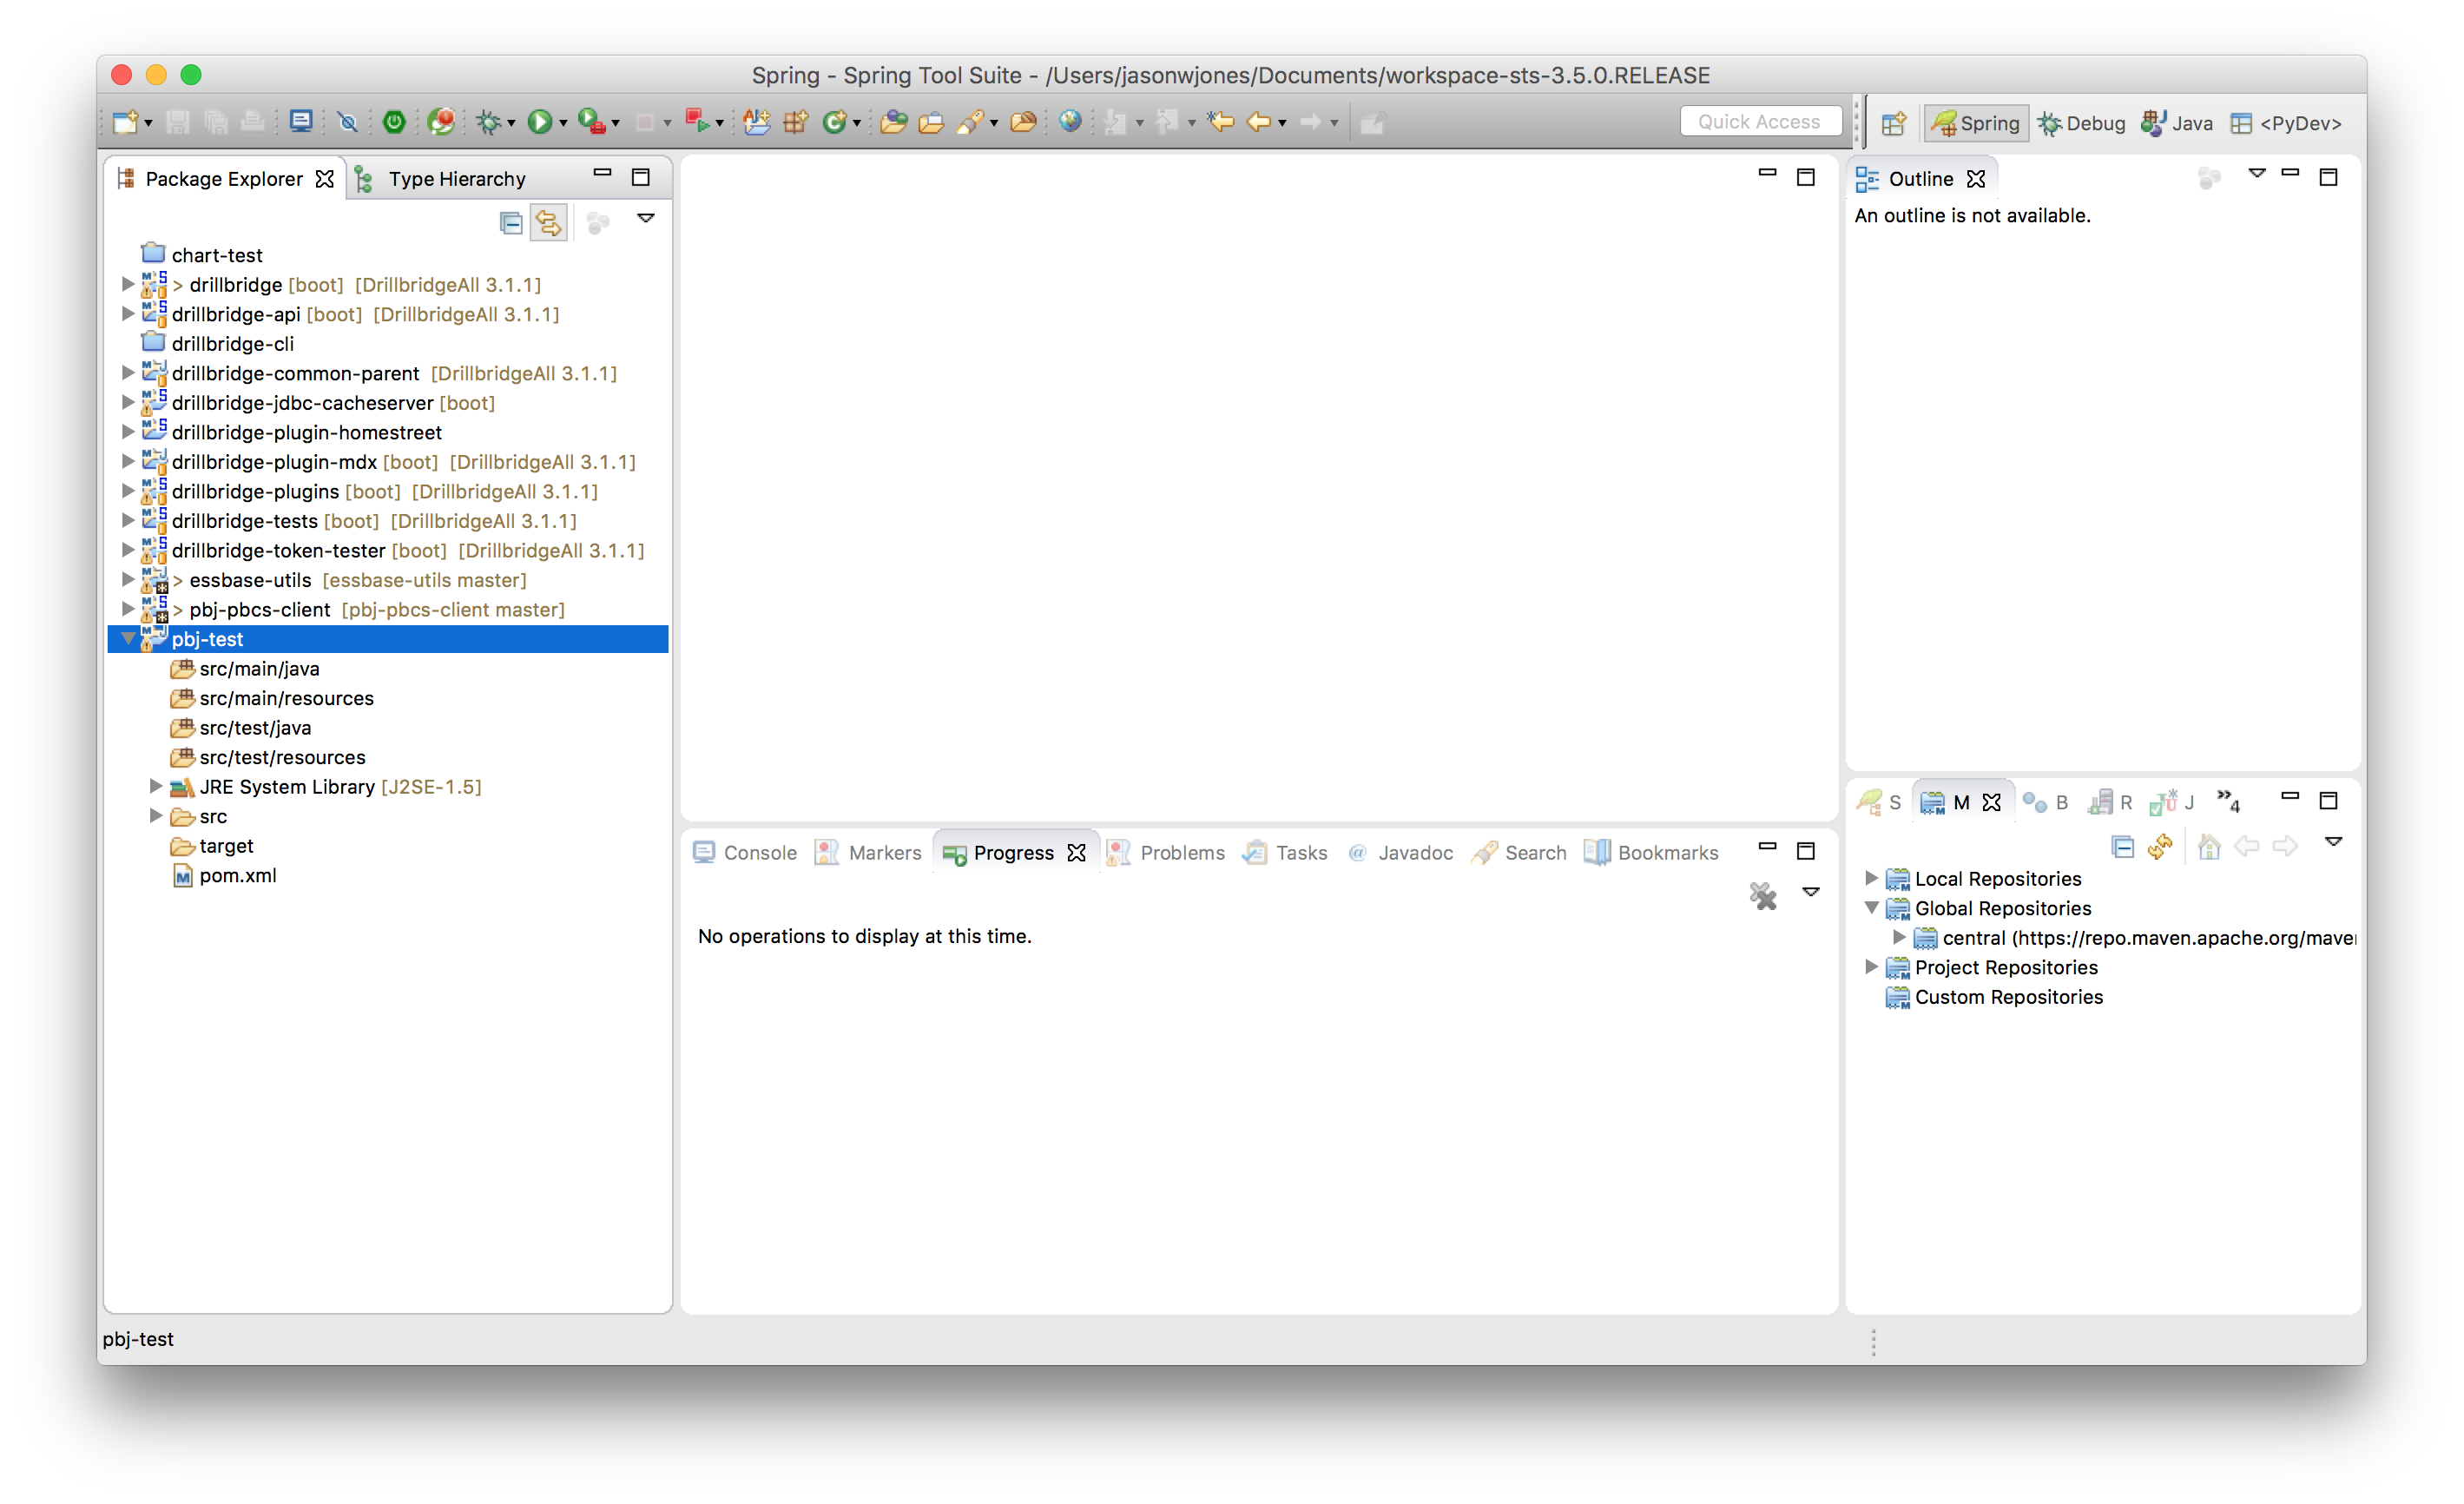
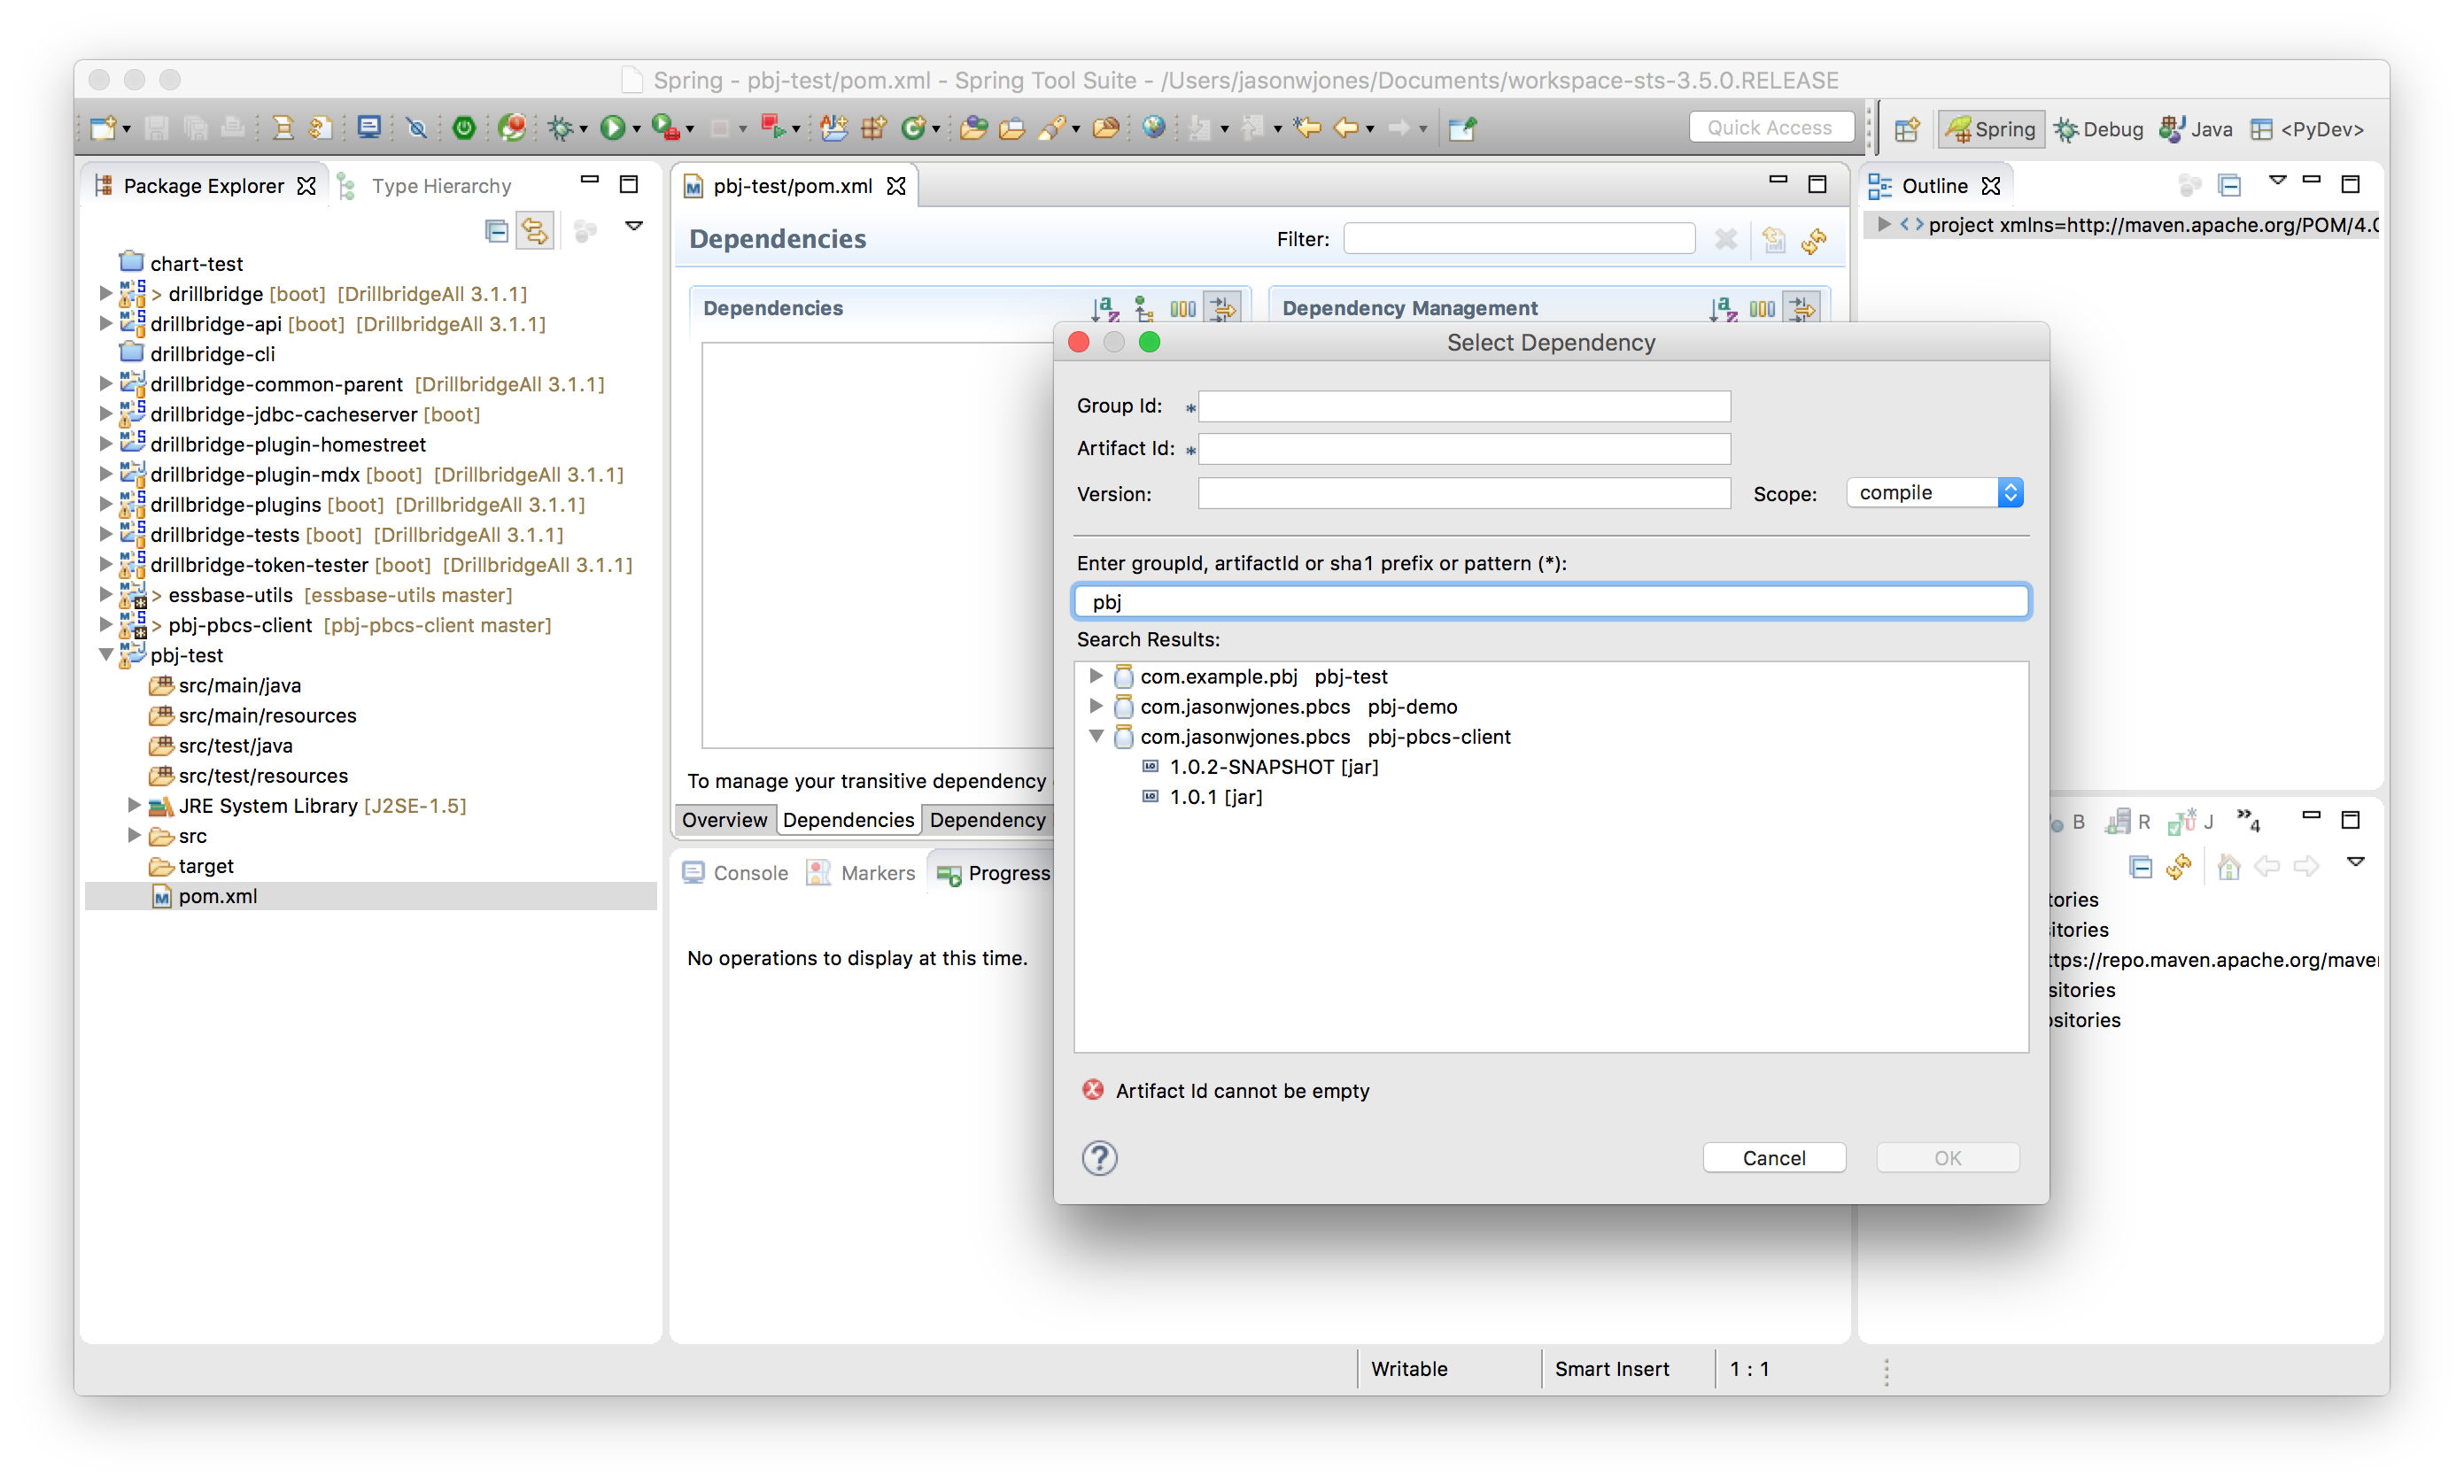
First, let’s assume we’ve already created a new empty Maven project in Eclipse. Your experience will vary if you use IntelliJ IDEA or some other IDE. In this example I happen to be using Springsource Tool Suite (STS), which is pretty much the same as Eclipse.

pbj-up-and-running-01-empty-project

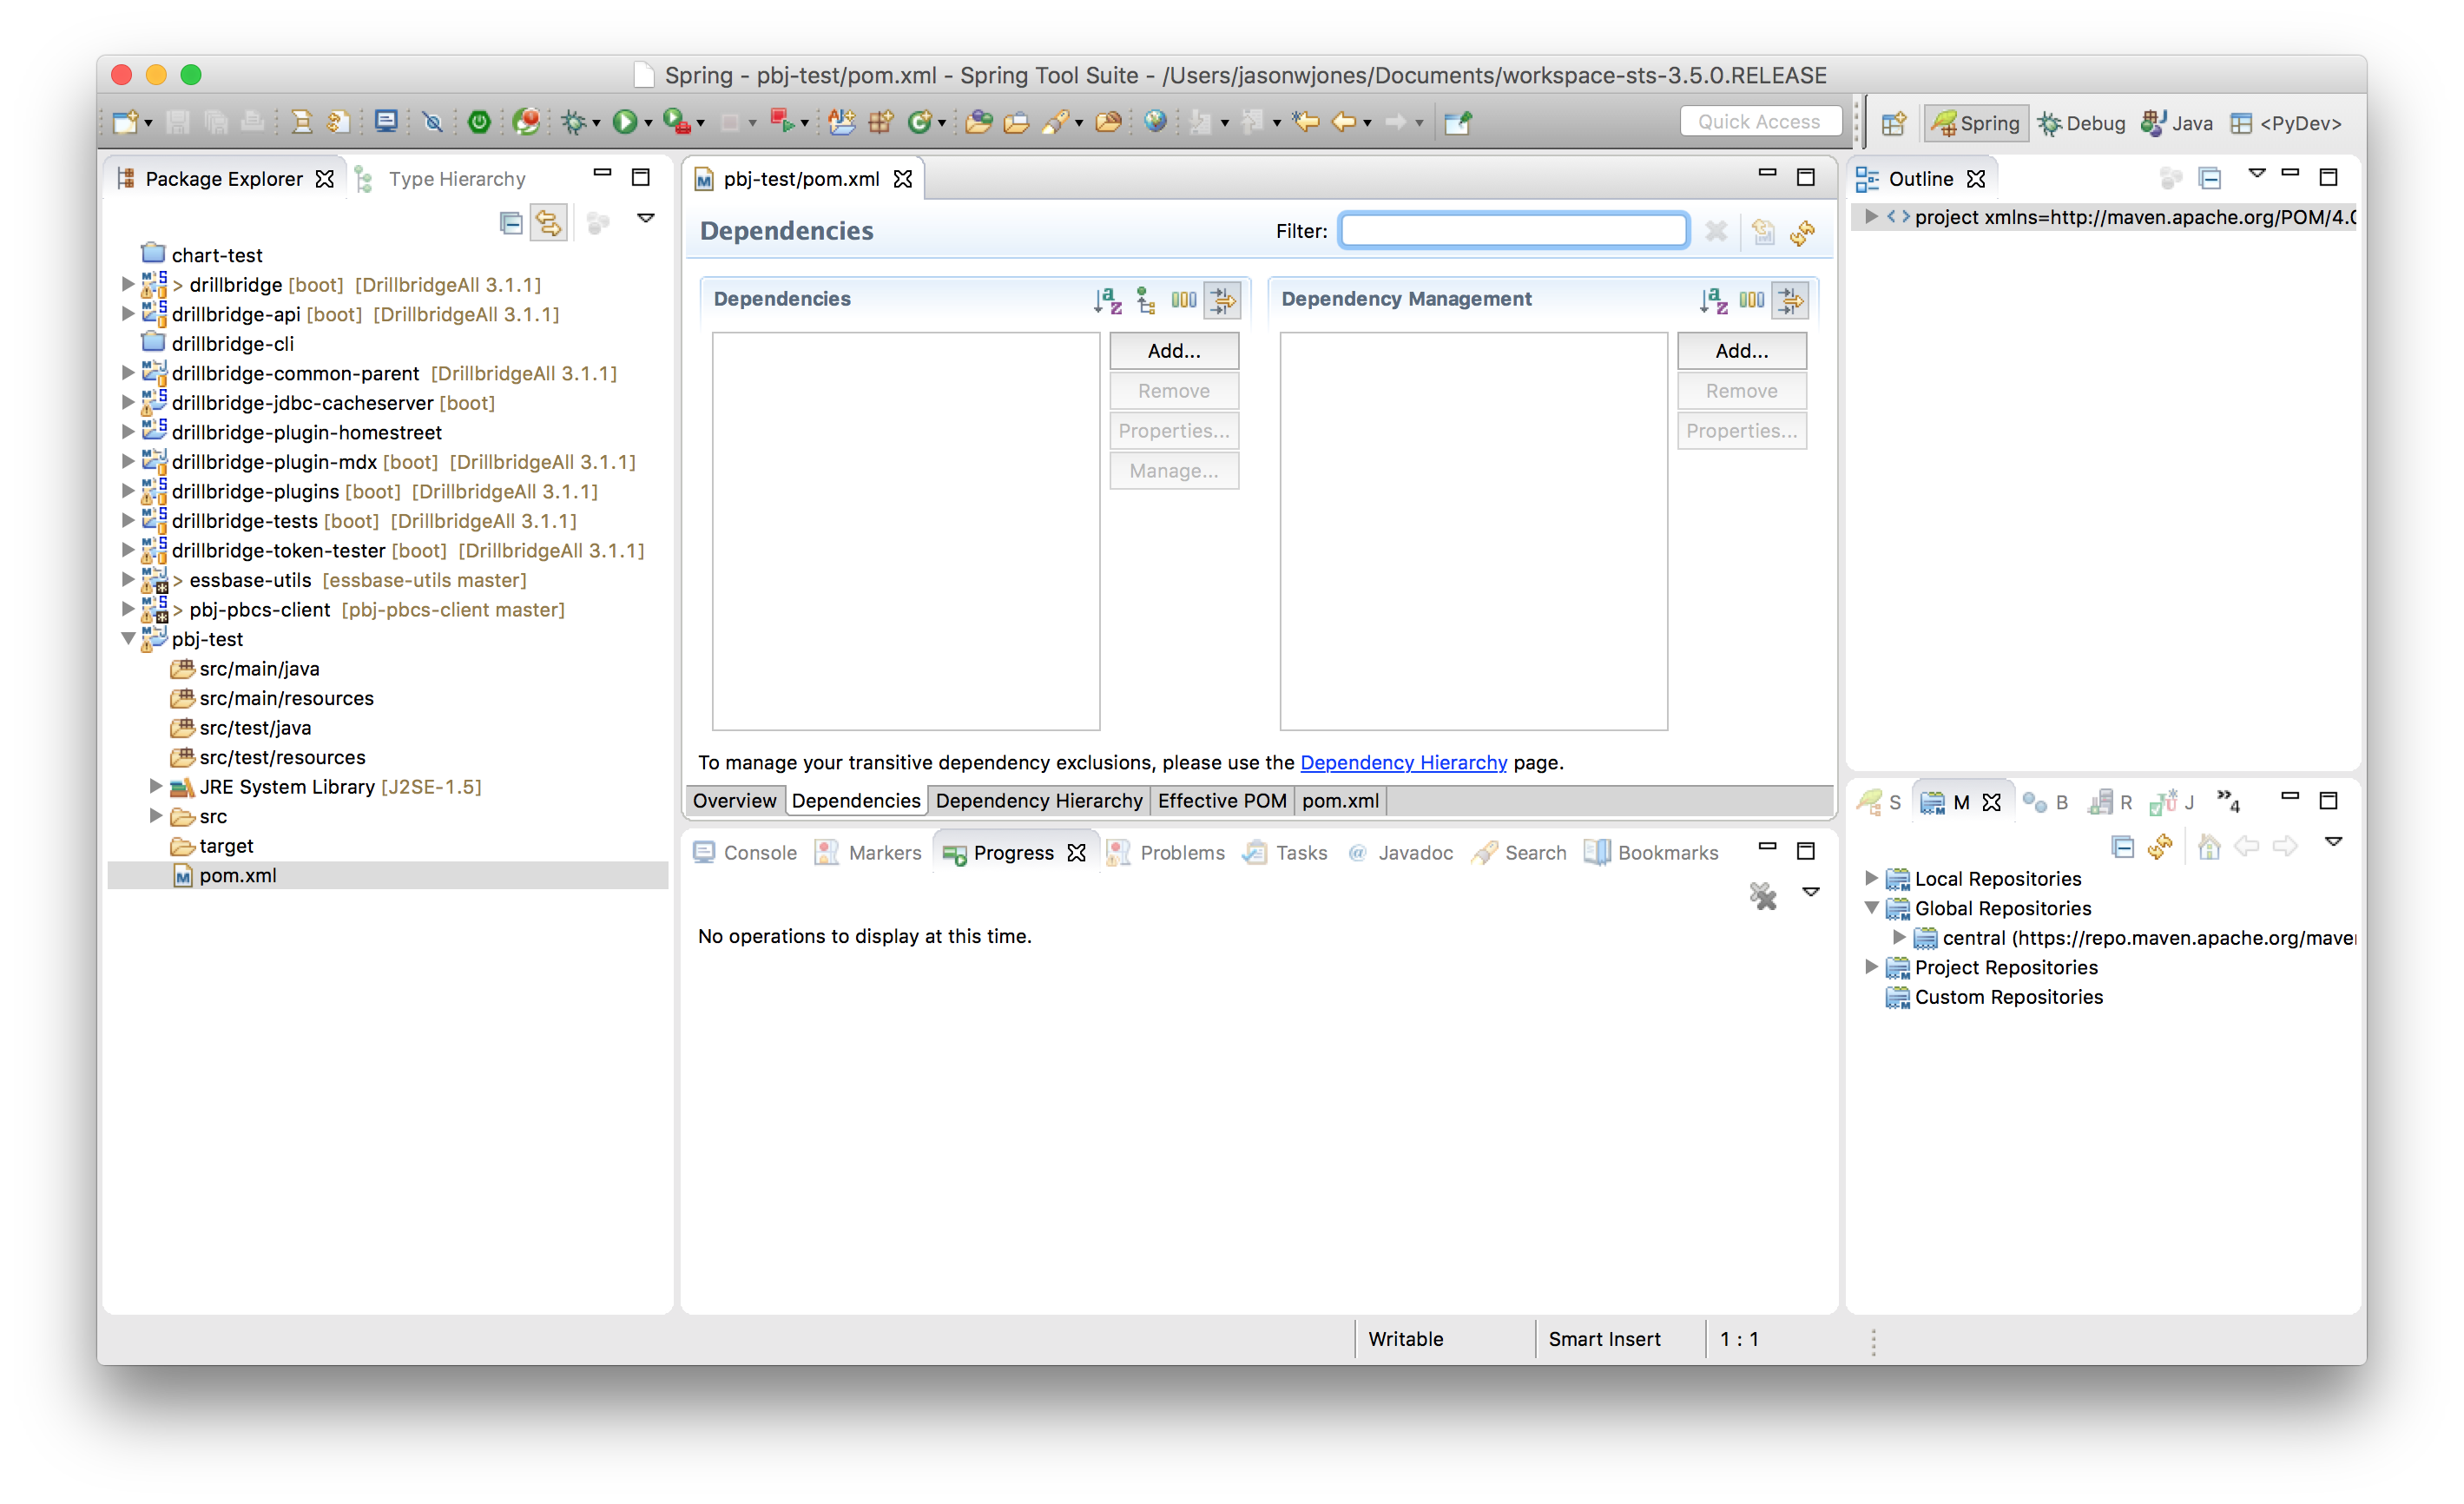
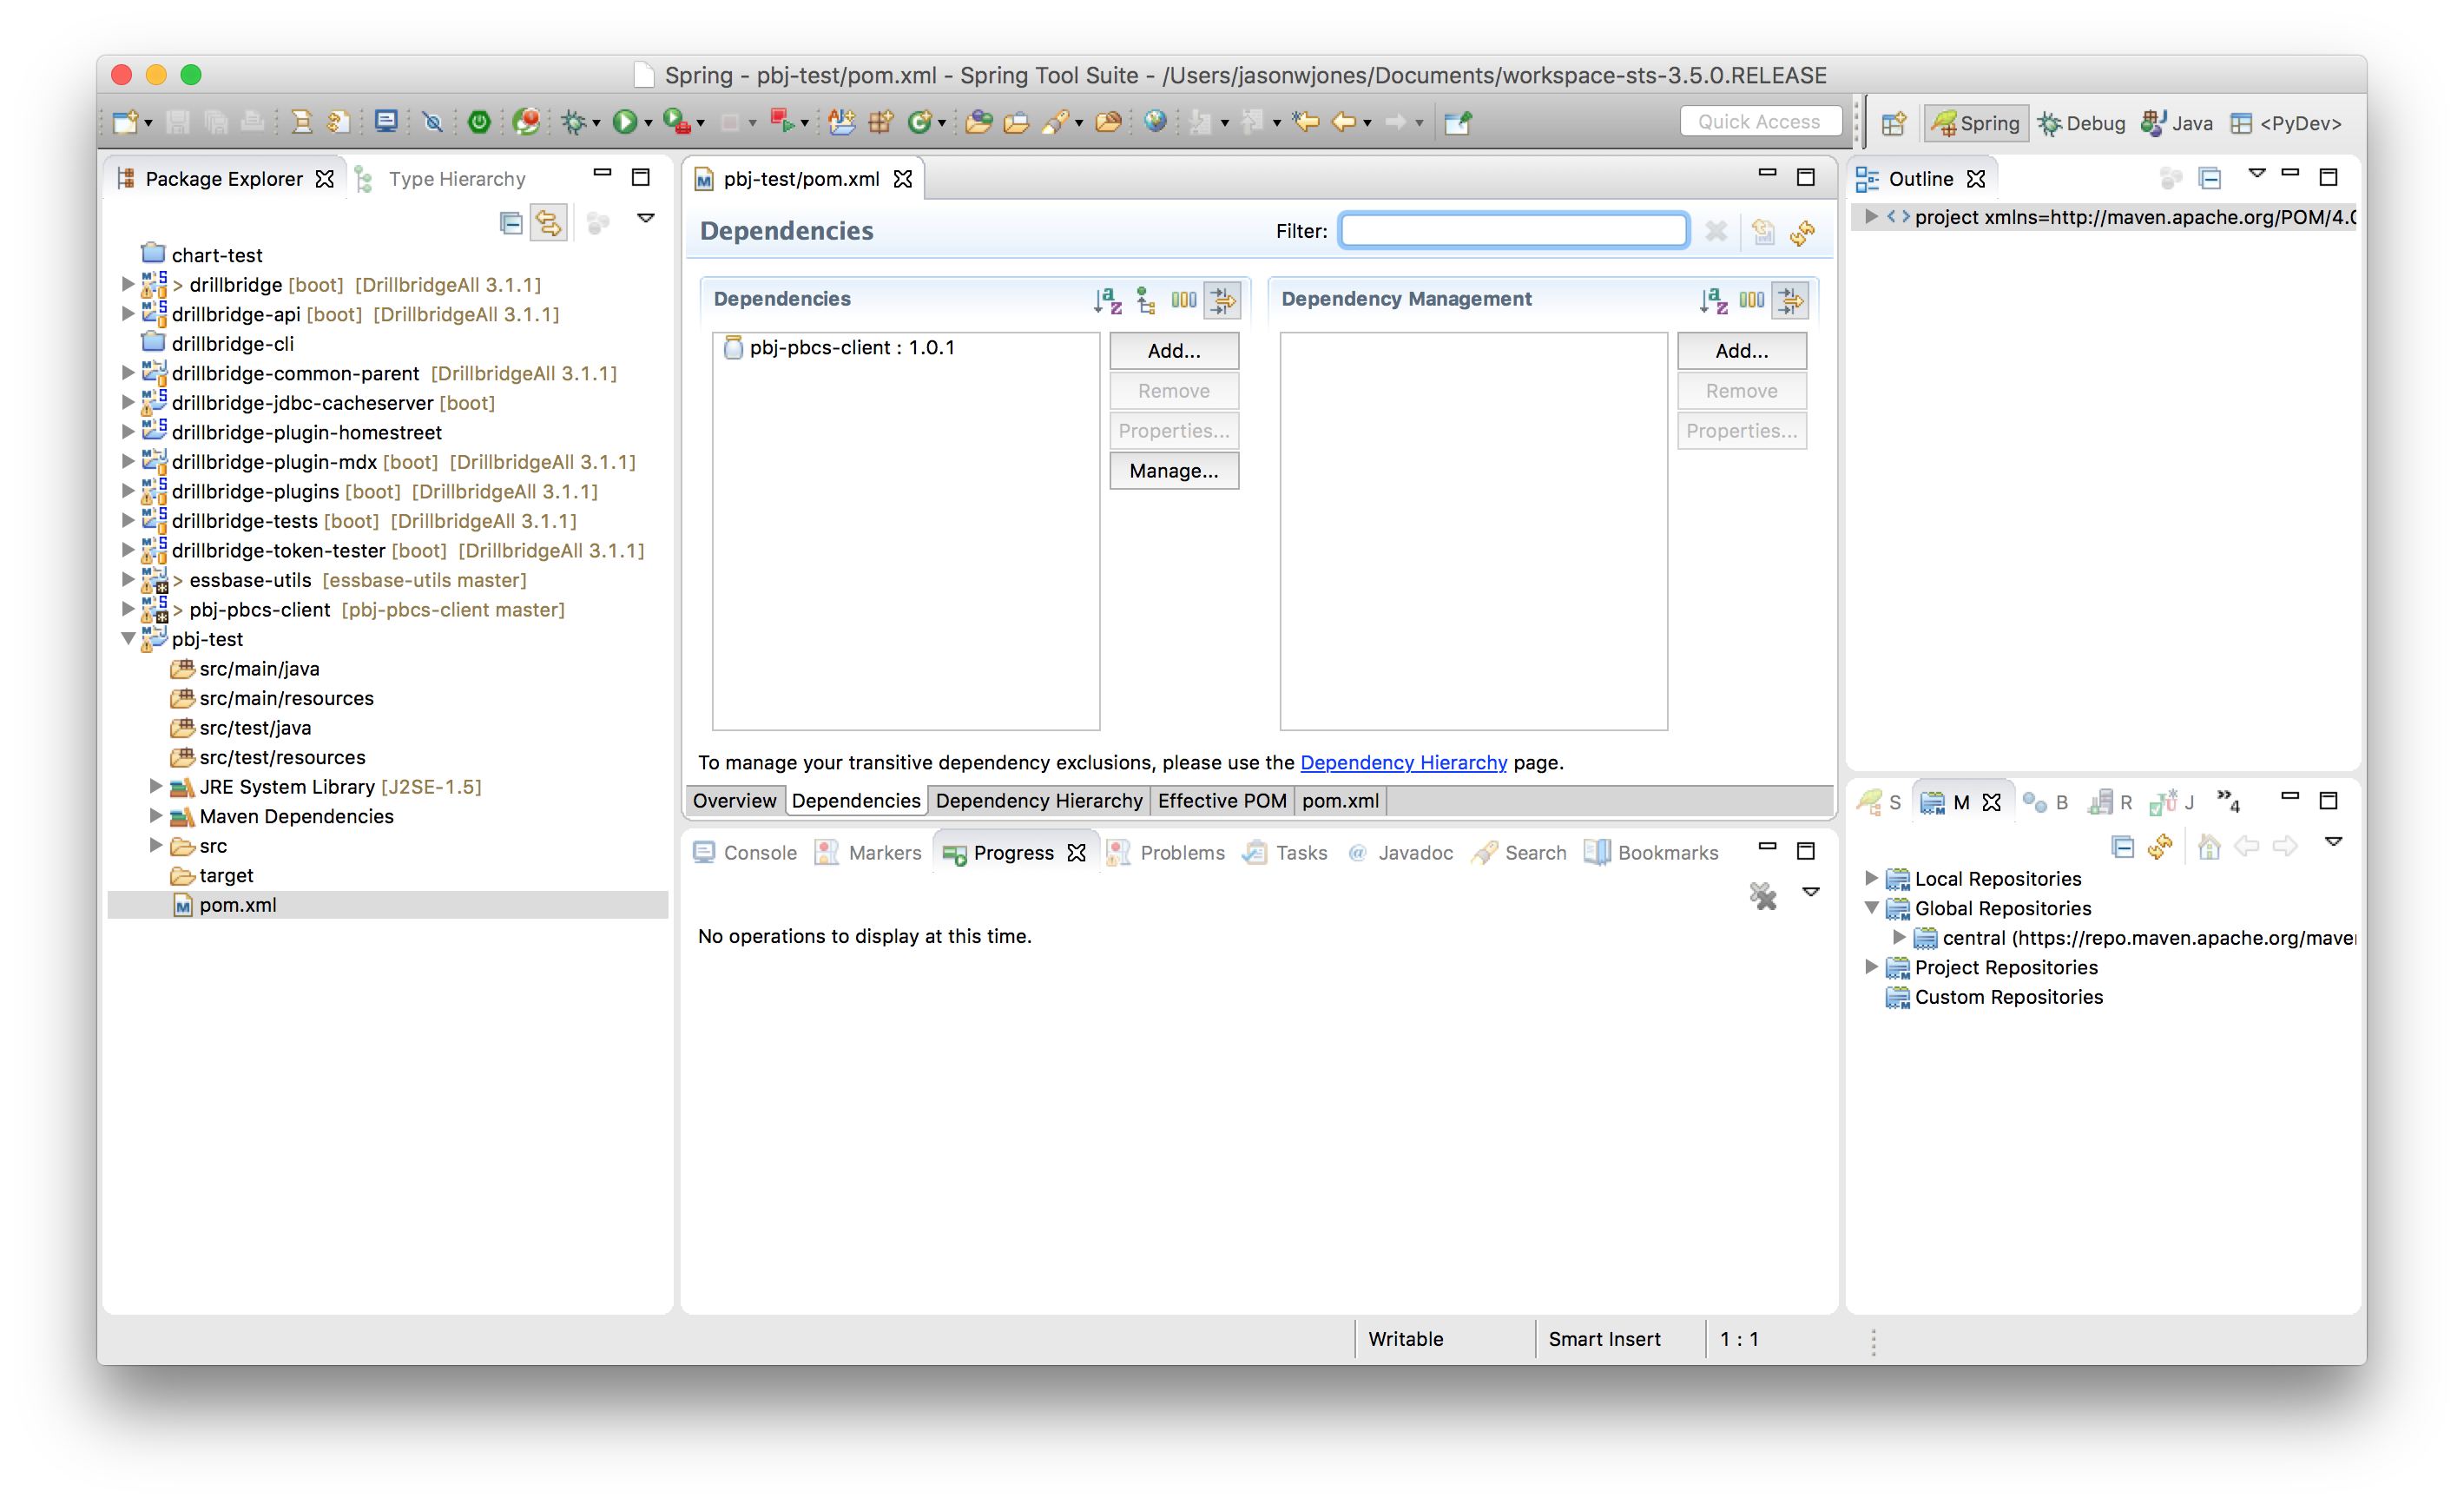
Next we need to open up our pom.xml (project definition file) to add a new dependency. You can do this manually by editing the XML file itself, but there’s a nice enough GUI in Eclipse that makes things even easier:

pbj-up-and-running-02-pom-editor

Next we need to go find the PBJ library. As I mentioned earlier, PBJ is available in the global Maven Central repository. If you have Maven set to update its index periodically or upon startup of your IDE, then you should be up to date and can find the PBJ library. As of right now the version of PBJ is just 1.0.1.

pbj-up-and-running-03-pbj-maven-dependency

Select the library, click OK, and then save the file. The PBJ library and its dependencies are added to your project.

pbj-up-and-running-04-pbj-added

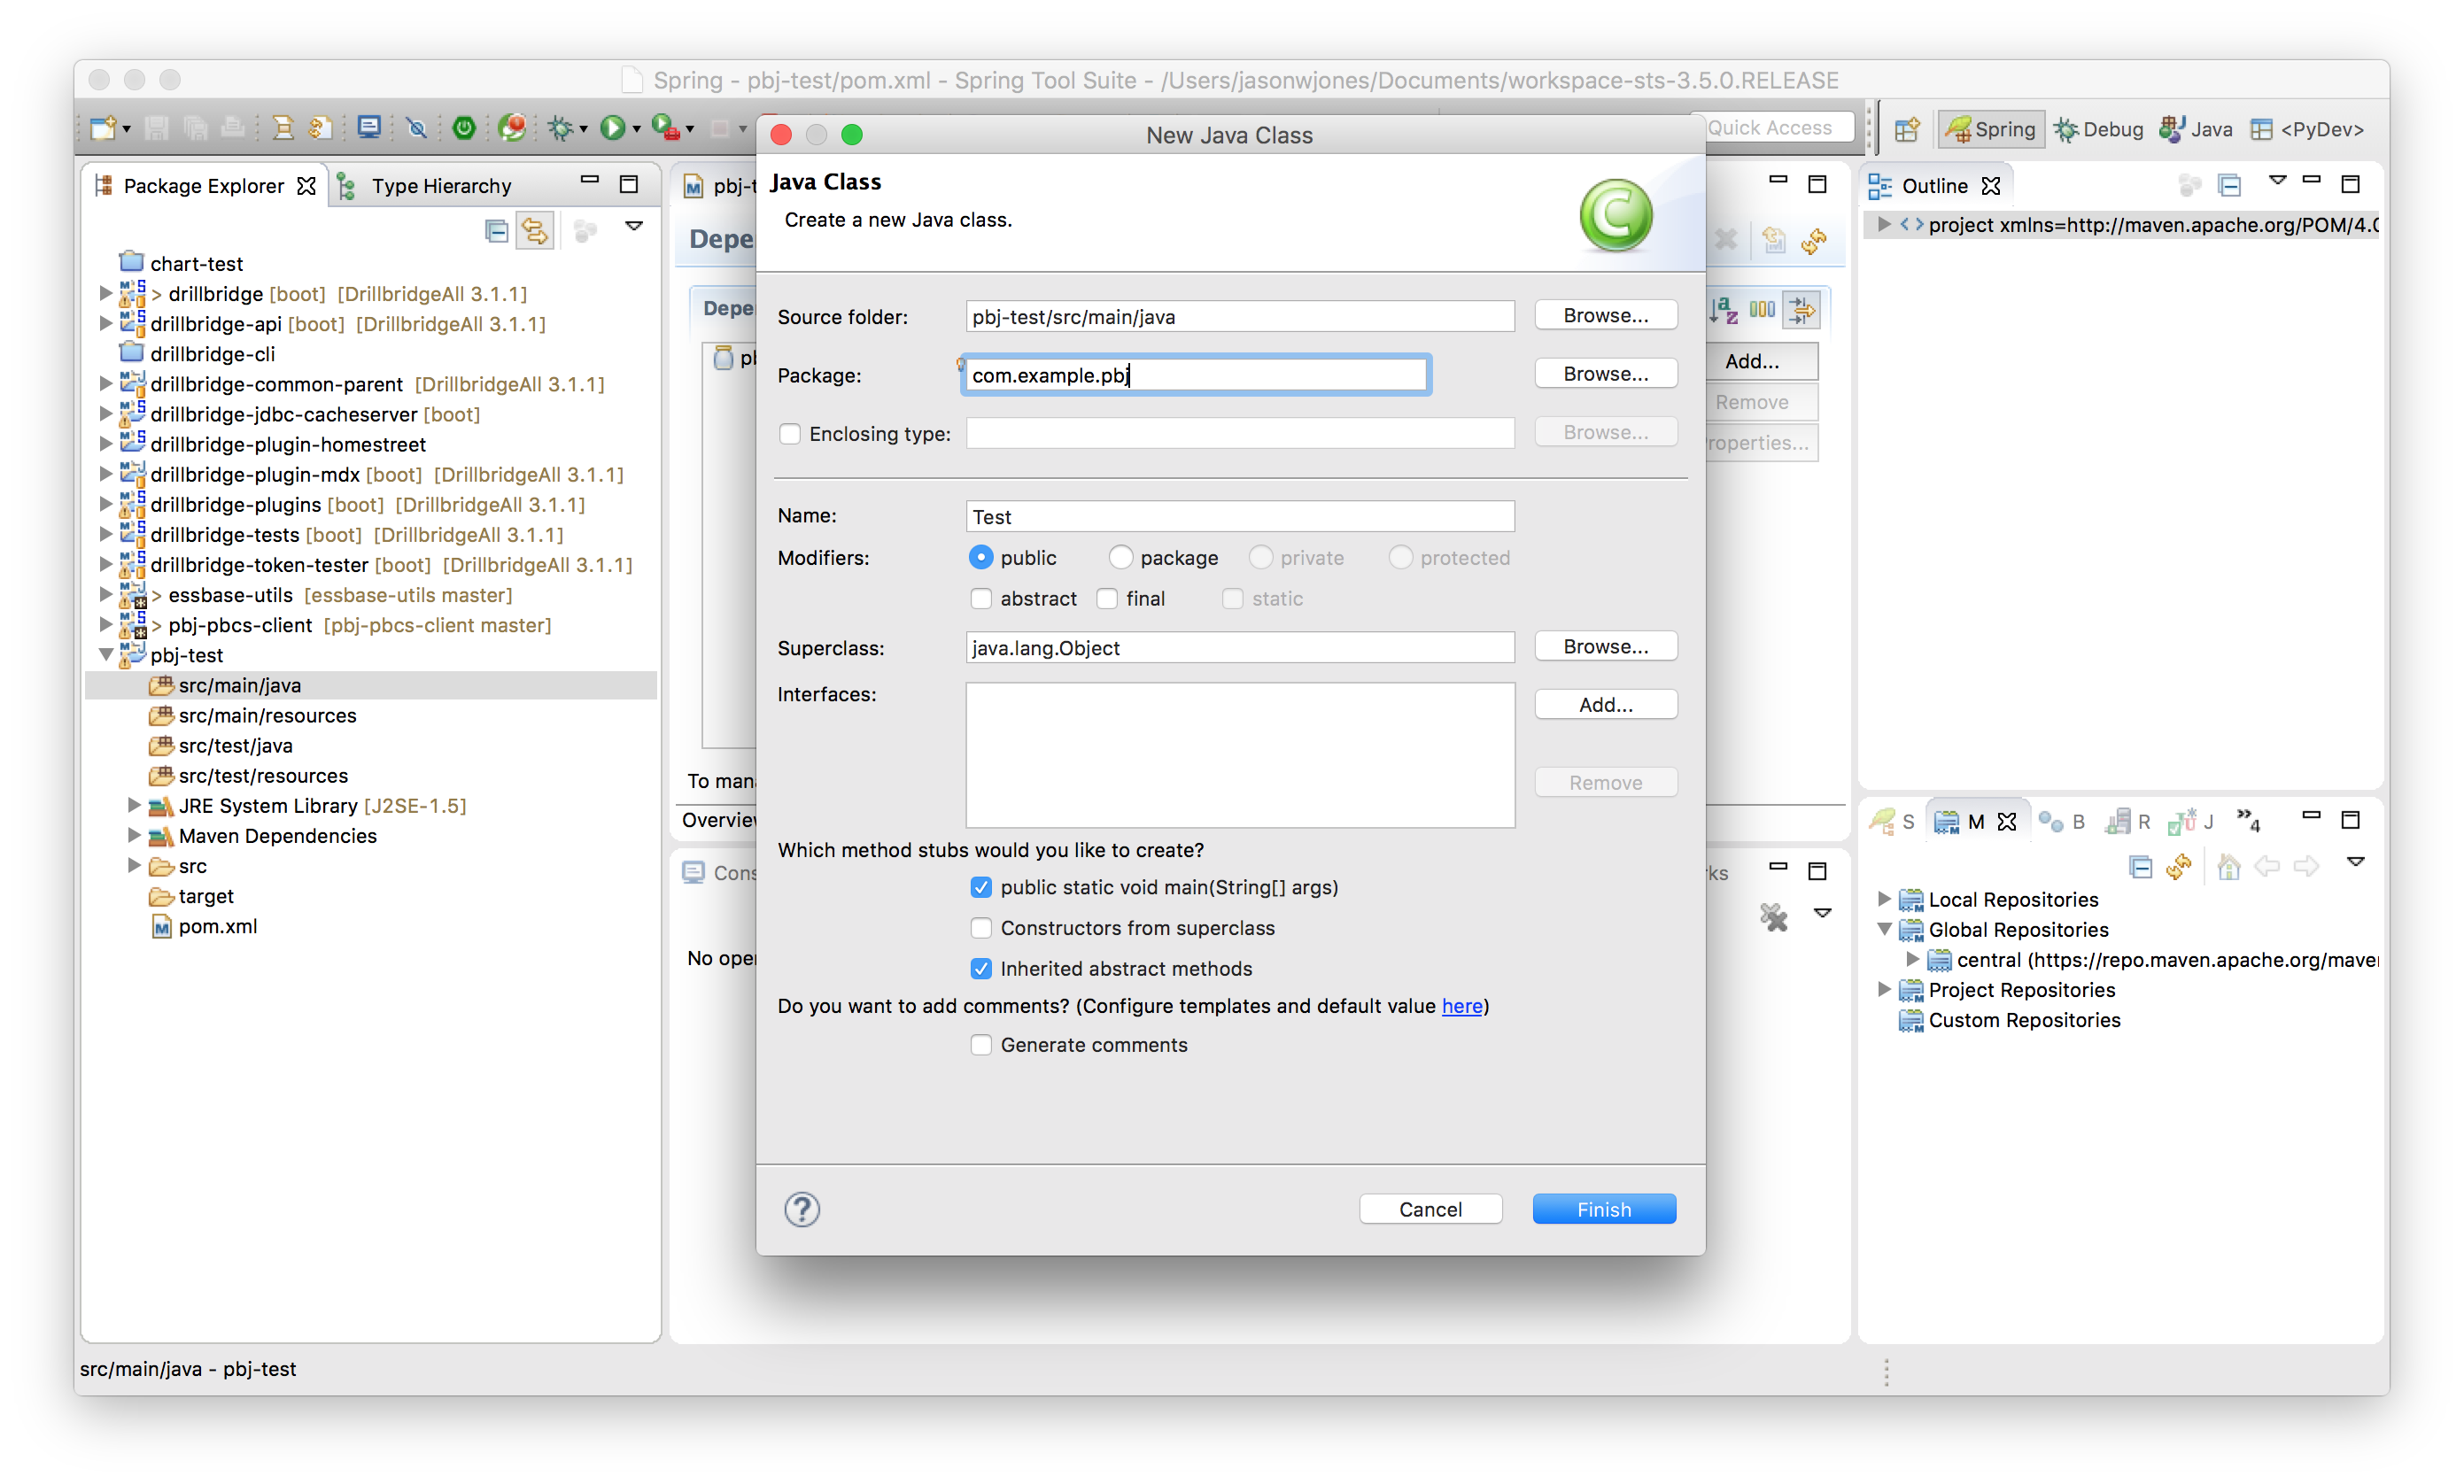
Now we can create a new main class to test things out. At this point it’s just life as normal for the Java developer:

pbj-up-and-running-05-new-main-class

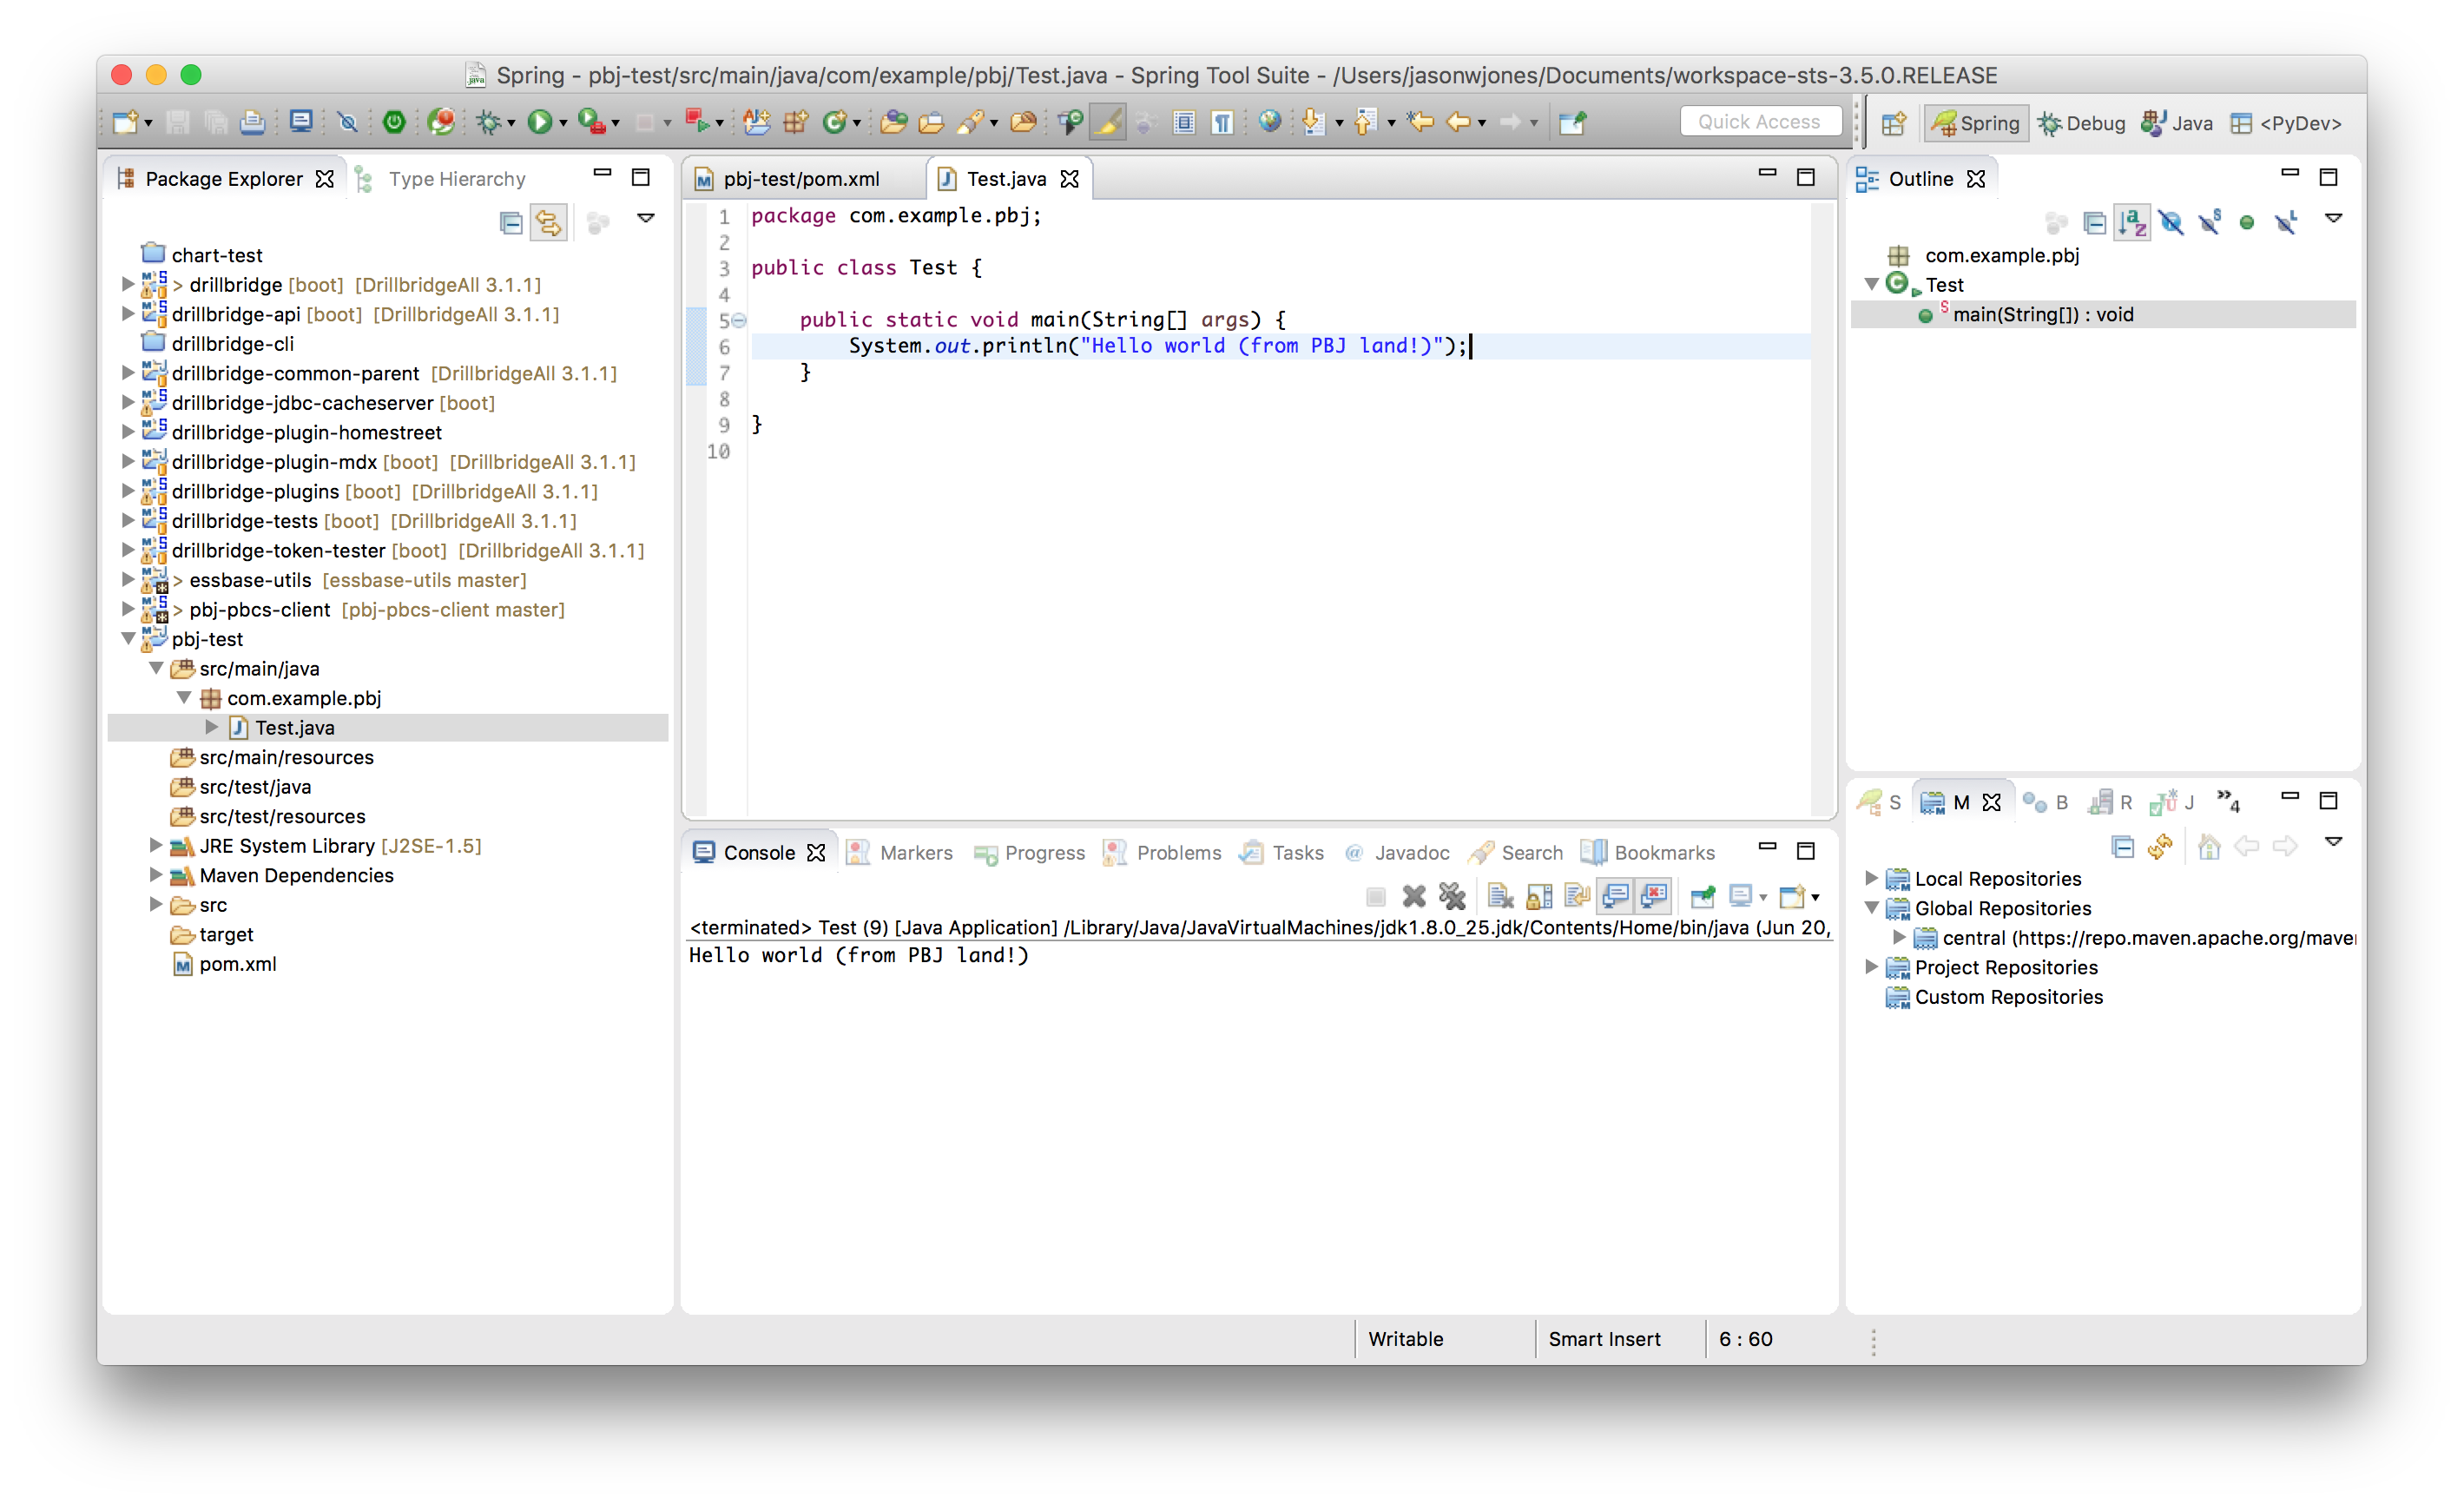
Just for good measure (and tradition!) let’s put in a simple code to print out “Hello world”, and run it. Note the output in the bottom middle pane:
pbj-up-and-running-06-hello-world

At this point we have project setup, we have all of the necessary PBJ files (and some additional transitive dependencies), and we are ready to write some Java code that uses methods in the PBJ library. The code to write is shown below:

pbj-up-and-running-07-refresh-cube

In the code you can see the following happen:

  1. A connection details object is created
  2. A connection to PBCS is made
  3. Ask for the list of available apps
  4. Print out the list of available apps
  5. Get a reference to a particular app (“Vision”)
  6. Call the refreshCube method on the app reference to refresh the cube
  7. Print message after cube refresh

It’s hard to imagine this code being much simpler. If might look like greek if you’re not familiar with programming or Java, but to a Java programmer, this will be readily comprehensible and its intent obvious. PBJ supports most of the REST API – importing data, metadata, business rules, and more.

To see a specific use-case and hear wry commentary from myself and Cameron, please swing by our presentation. We’ll cover an example of PBJ (don’t worry, it’s higher level than this!) but more generally some facets of administration of on-prem versus PBCS will be discussed as well. I think the presentation will really appeal to many different user groups.

Cascading Reports with Dodeca

One of Dodeca’s banner features is its incredibly advanced support for cascading reports. In case you’re not familiar, cascading reports are where multiple views or reports are built for all different permutations of given parameters. How this generally relates to the world of reporting is that we may want to choose multiple items across several different dimensions, then generate a report or view for each different combination.

For example, consider an Income Summary report where a user would want to choose a particular location, scenario, and product combination. In Dodeca, these would each be a selector associated with a report. As an administrator, when I am designing my report, I  associate these selectors with my report. When an end-user of the report goes to build it, they will be presented with choices from each dimension to simply choose from.

Of particular note is that the end-user doesn’t really need to know what a selector is, how it’s configured, where its data comes from, or anything. All they need to know is that they can click on whatever they want and nicely formatted data will be presented to them in a familiar, intuitive format. Incidentally, quite often the format of the report that comes back is their own design – some gnarly spreadsheet that used to take minutes or hours to painstakingly refresh, and now comes back reliably and quickly, every time, with the push of a button.

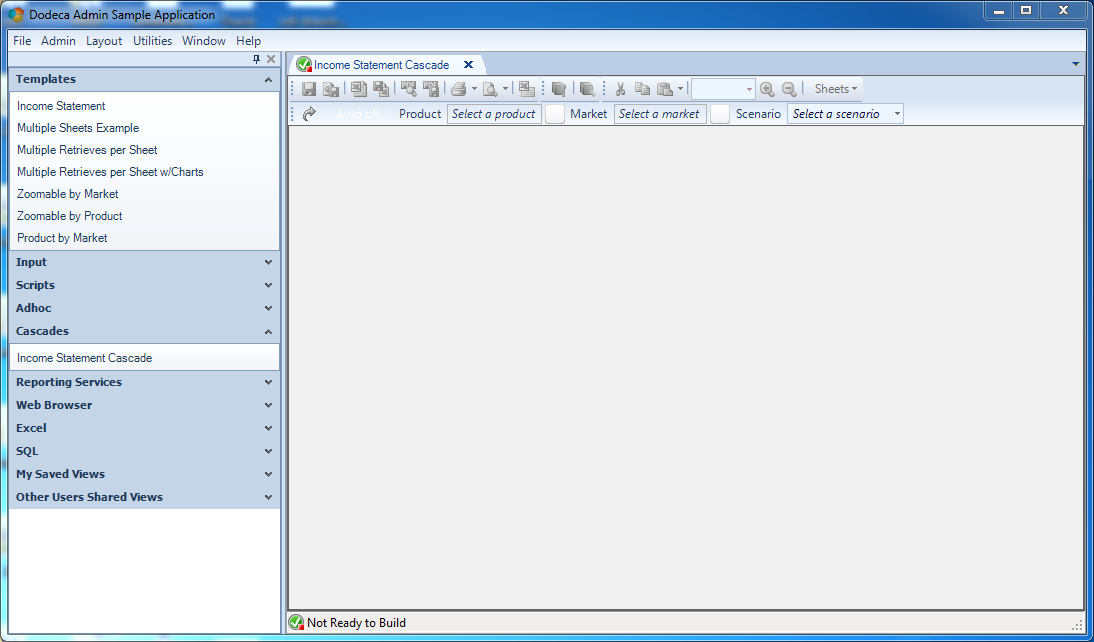
Let’s take a look at how this plays out for a user, using a simple Income Summary report. First, let’s load the view by clicking on it:

dodeca-cascades-01-unconfigured-view

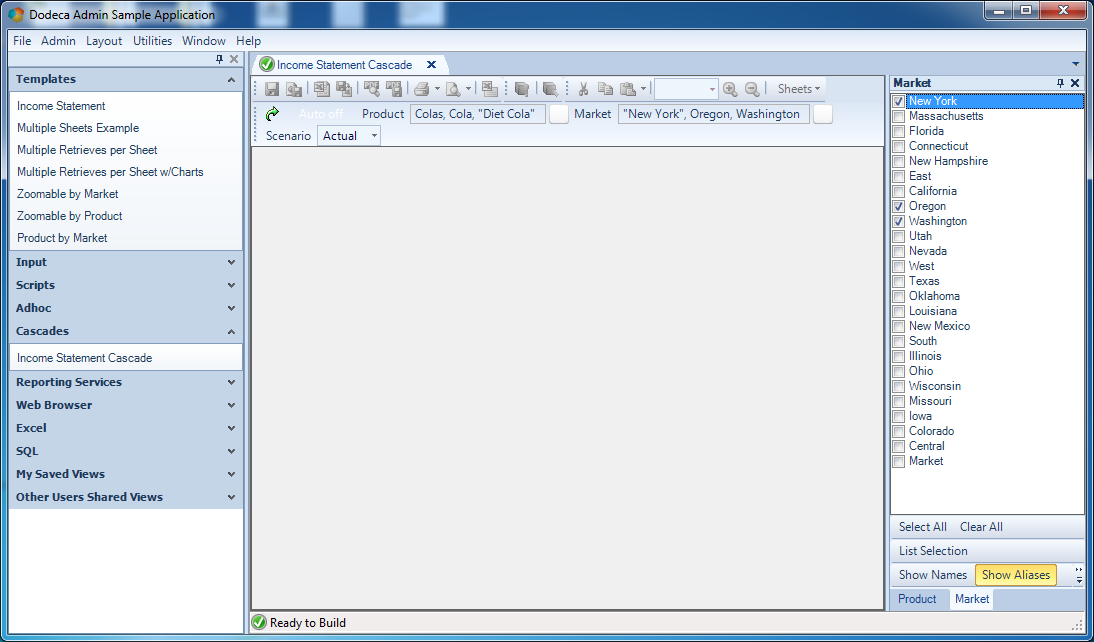
The report has not run yet, we must choose selections for each selector, then run it.

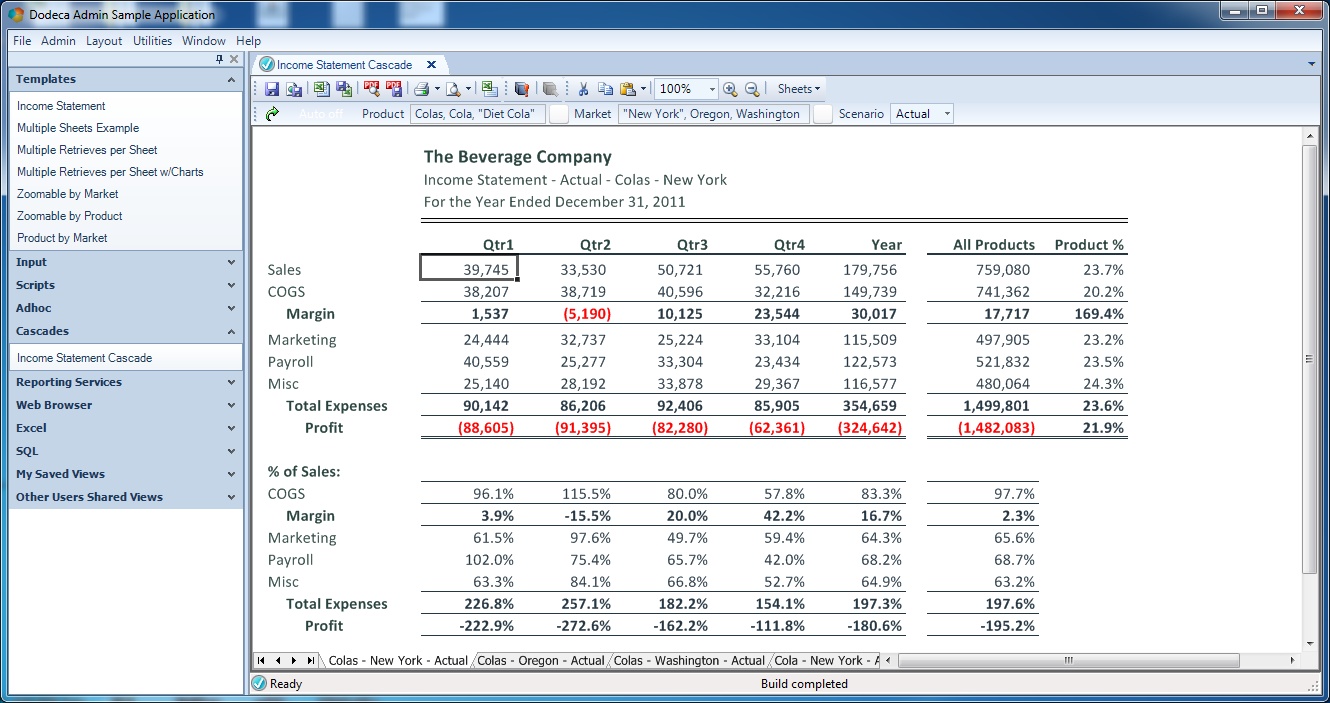
dodeca-cascades-02-selectors-configured

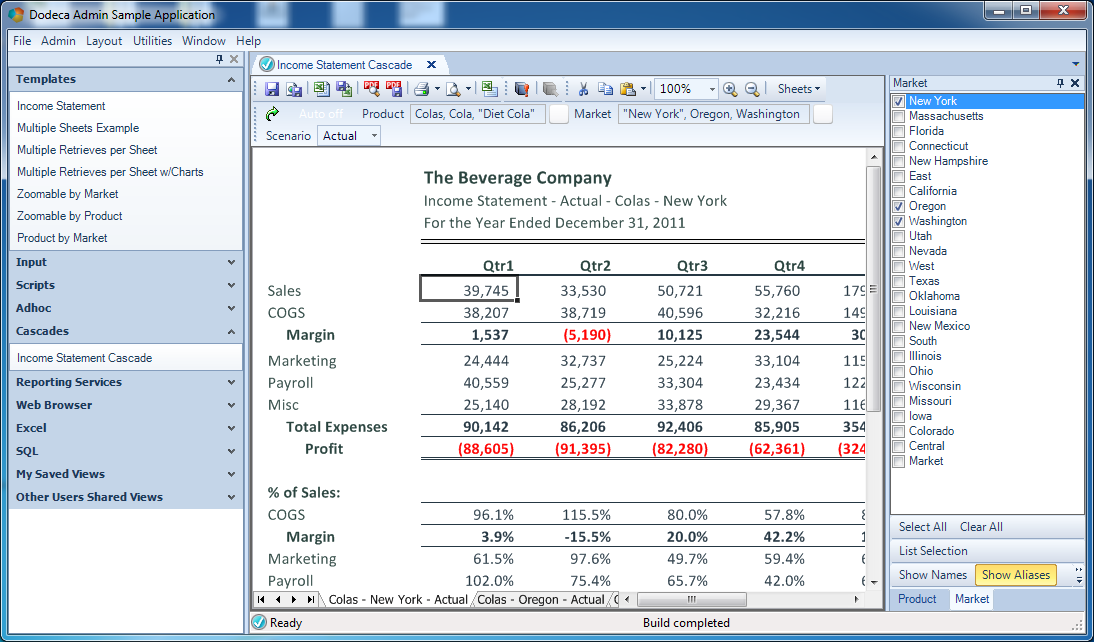
Now we have selections for each selector: notice that we want Colas, Cola, and Diet Cola from the product dimension, New York, Oregon, and Washington for the Location, and Actual for the scenario. The number of permutations of report is 9: 3 locations times 3 products times 1 scenario. Now that we have selections made, we can run the report.

dodeca-cascades-03-built-report

Notice the different tabs at the bottom of the sheet. Let’s collapse the selectors to get a little more real estate for the view and the tabs:

dodeca-cascades-04-tab-view

As you can see, a custom tab name based on the value of the selector for that tab was generated. The first tab is Colas – New York – Actual. This is one of those times when something simple goes a long way for the user: instead of some terse or generic name, the exact description is used. The text of the tab is even configurable (of course), if we need something a little more custom than just the names of the items.

Before I delve into the administrator configuration of cascading, I want to take a brief moment to wax technical on some of the power and flexibility we’re seeing.

Dodeca reports aren’t limited to a single datasource, a single type of data source, or even a single version of data sources. Dodeca’s flexible and robust spreadsheet paradigm allows it to arbitrarily combine, use, and build data from any number of data sources, even on a single sheet. For example, we could build a view that pulls some data from a relational database, and then uses it to build several retrievals from multiple Essbase cubes, all on the same sheet. So consider this: we can give our users the ability to build such a report, with disparate and heterogenous data sources, and have the report be built dynamically for every given permutation of selections – selections which, by the way, themselves may be from multiple data sources. The selections in the above screenshots all happened to come from the dimensionality of an Essbase cube but they could have just as easily come from a dynamic SQL query.

Under the Hood with Cascade Configuration

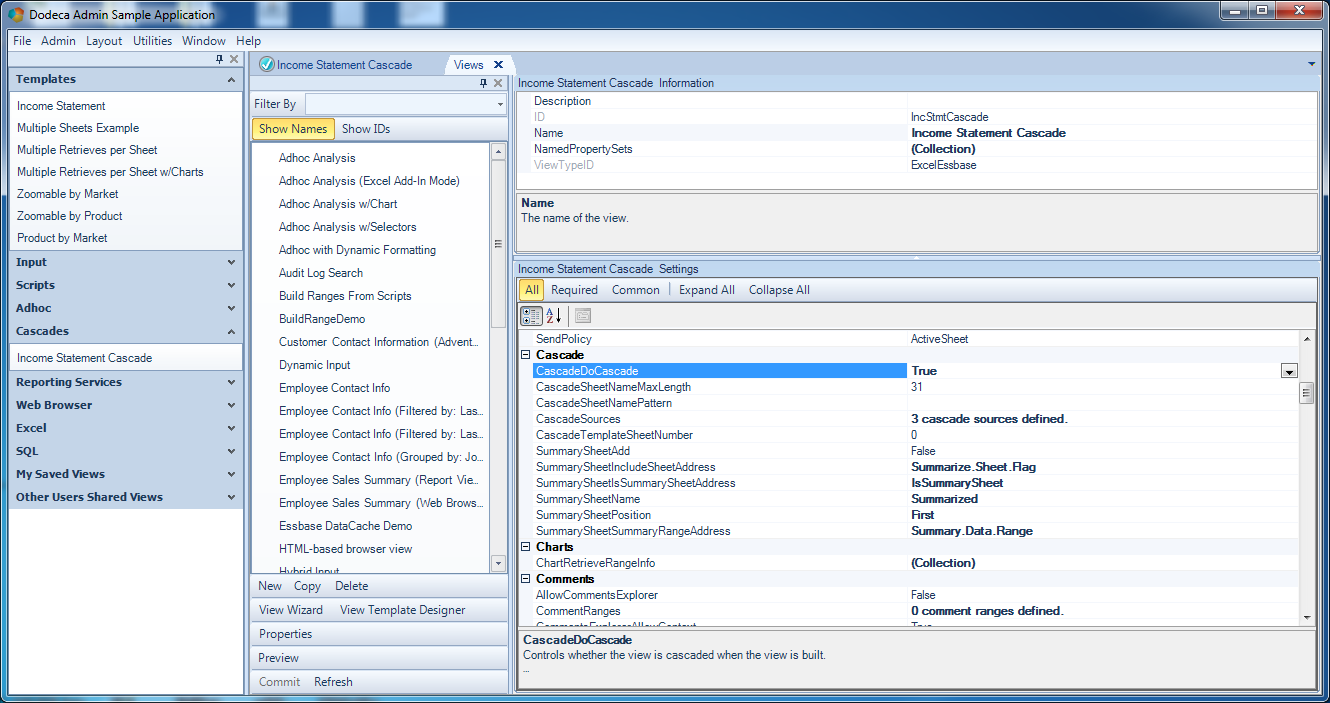
Now that I’ve shown an example of a cascading report, let’s talk a little about how it’s setup under the hood by the Dodeca administrator or report builder. Of the numerous properties we can use to configure and fine-tune the behavior of a view, there is a dedicated section for the cascading options:

dodeca-cascades-05-cascade-configuration

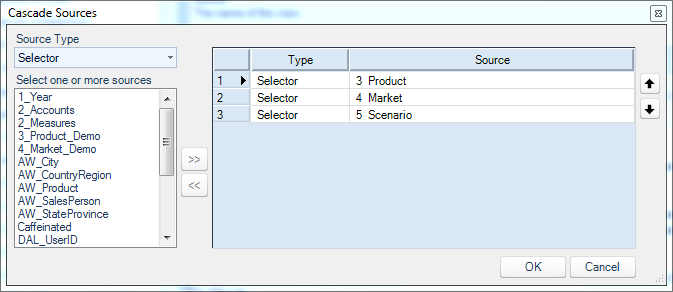
Generally we are okay with the defaults for the cascade options so we can leave them alone. The main thing we need to configure is to tell Dodeca which selectors will participate in the cascade. We can further configure options for Cascade Sources:

dodeca-cascades-06-cascade-sources-configuration

That’s it – that’s all there is to it. Keep in mind that in Dodeca, selectors are highly reusable components that are used across multiple views/reports. So we didn’t really have to do any special one-off setup for these selectors, just grab and go.

Stay Tuned

Stay tuned for more this week as I do a daily blog post about a particular feature of software in the Applied OLAP software suite. More to come!

Kscope16 is almost here!

Here we are again, just less than a week before Kscope16. I say this every year but this year’s Kscope promises to be the best yet, and I’m starting to get really pumped. There are a lot of exciting things going on in the greater Essbase world right now, and even my own little corner of this world is quite exciting (to me at least), including such fun things:

All of these items will be present at the conference, in one form or another. Dodeca will be featured in several presentations this year as customers talk about their implementation successes. Drillbridge has its own presentation again this year, given by yours truly, the outline extractor has a session put on by Tim, and the PBJ library will make up about half of a presentation with Cameron talking about on-prem versus PBCS.

That all said, this week I’m going to blog daily about some of the cool things in the world of Dodeca, Drillbridge, the Outline Extractor, and more. Stay tuned for a busy week!

Towards Spreadsheet Management

I follow quite a few Hyperion related blogs. Years ago there weren’t too many of them but now I’m quite pleased to be able to follow dozens of them with my RSS reader of choice. The other day I read an article posted by Edward Roske titled “7 Signs Your EPM Is Lagging Behind Your Competition”. Edward has been working with Hyperion for a long time and runs one of the more well known consulting firms, so he has seen quite a bit. And his thoughts are insightful. While I was reading through the article I couldn’t help but read it with a “Dodeca colored lens”, if you will.

For example, one of the signs is that strategy is planned verbally or in spreadsheets. The interesting thing here is that the spreadsheet modeling paradigm itself is a robust and essential. Where things go sideways is with how the files themselves are managed (and mismanaged).

For example, consider a typical analyst or a power user analyst that creates a spreadsheet: some pulls from Essbase, perhaps some relational data pasted in, some formulas, multiple tabs, formatting, and all that fun stuff. So far so good (well, not really, but let’s say it is). Now they email it out. Some feedback comes in from the CFO. Now the sheet Profitability Q3 2016 becomes something like Profitability Q3 2016 – Revised. More feedback comes in. More meetings. Now it’s Profitability Q3 2016 (2). Teresa down the hall needs a copy, so the analyst copes it to the LAN. Teresa makes some changes but the analyst has a lock on the file, so she saves Profitability Q3 2016 (2) – Teresa. I’ve seen some pretty heinous file management in my time.

This is an all too common scenario in the world of spreadsheets. Things get ugly quickly. And this is to say nothing of links across tabs and sheets and a host of other bad practices that make the situation even more error prone and hard to manage.

Another sign from Edward’s blog is that Excel is the key enabling technology in your FP&A department. I agree completely with the sentiment here. Note that Excel is specifically mentioned – not the spreadsheet paradigm itself. Excel as the enabler of FP&A is yesterday; the flexibility of spreadsheets combined with the power of Essbase is tomorrow.

Some of Edward’s other points such as there is only one version of the budget and budgets favor precision over timeliness are also spot on in terms of their accuracy.

Enter Dodeca

To reiterate from the beginning of this post, I couldn’t help but read this blog article while thinking about Dodeca. It’s because Dodeca takes all of the best things about spreadsheets: their power, their expressiveness, their familiarity to so many finance users, leverages the power of Essbase, leverages data from relational databases, and marries it all up in one cohesive interface. It’s saving numerous people and companies a lot of time: time that is not spent laboriously refreshing report decks, time that is not spent copying files around, time that is not spent emailing files, time that is not spent posting things to SharePoint or the LAN, and even a fair bit of time on end-user training.

I’m really looking forward to this year’s Kscope in Chicago. There are multiple presentations by Applied OLAP customers on how they built solutions with Dodeca while increasing productivity and reducing risk. And of course, we at Applied OLAP will have a booth. Please swing by and say hello!


Drillable Columns in Drillbridge

One of the more often requests that Drillbridge users have is to be able to have drillable columns. That is, they’d like to drill from a column in a Drillbridge report by clicking on the column value and pulling up another report, using the point-of-view (POV) of the original cell. This is most often used in a few different situations:

  • Drill into yet more detail for a given transaction
  • Drill to a PDF or image related to the current item
  • Drill to a custom URL, such as a Sharepoint URL

Drillbridge has supported this feature for quite some time, and it’s pretty easy to setup. Today I’m going to walk through the steps for setting up drillable columns in the latest version of Drillbridge Enterprise.

First of all, let’s take a look at a generic Drillbridge report that executes a query by converting the member from the Years dimension from something like “FY12” into the value of “2012” and then executes a query:

drillbridge-drillable-columns-source-query

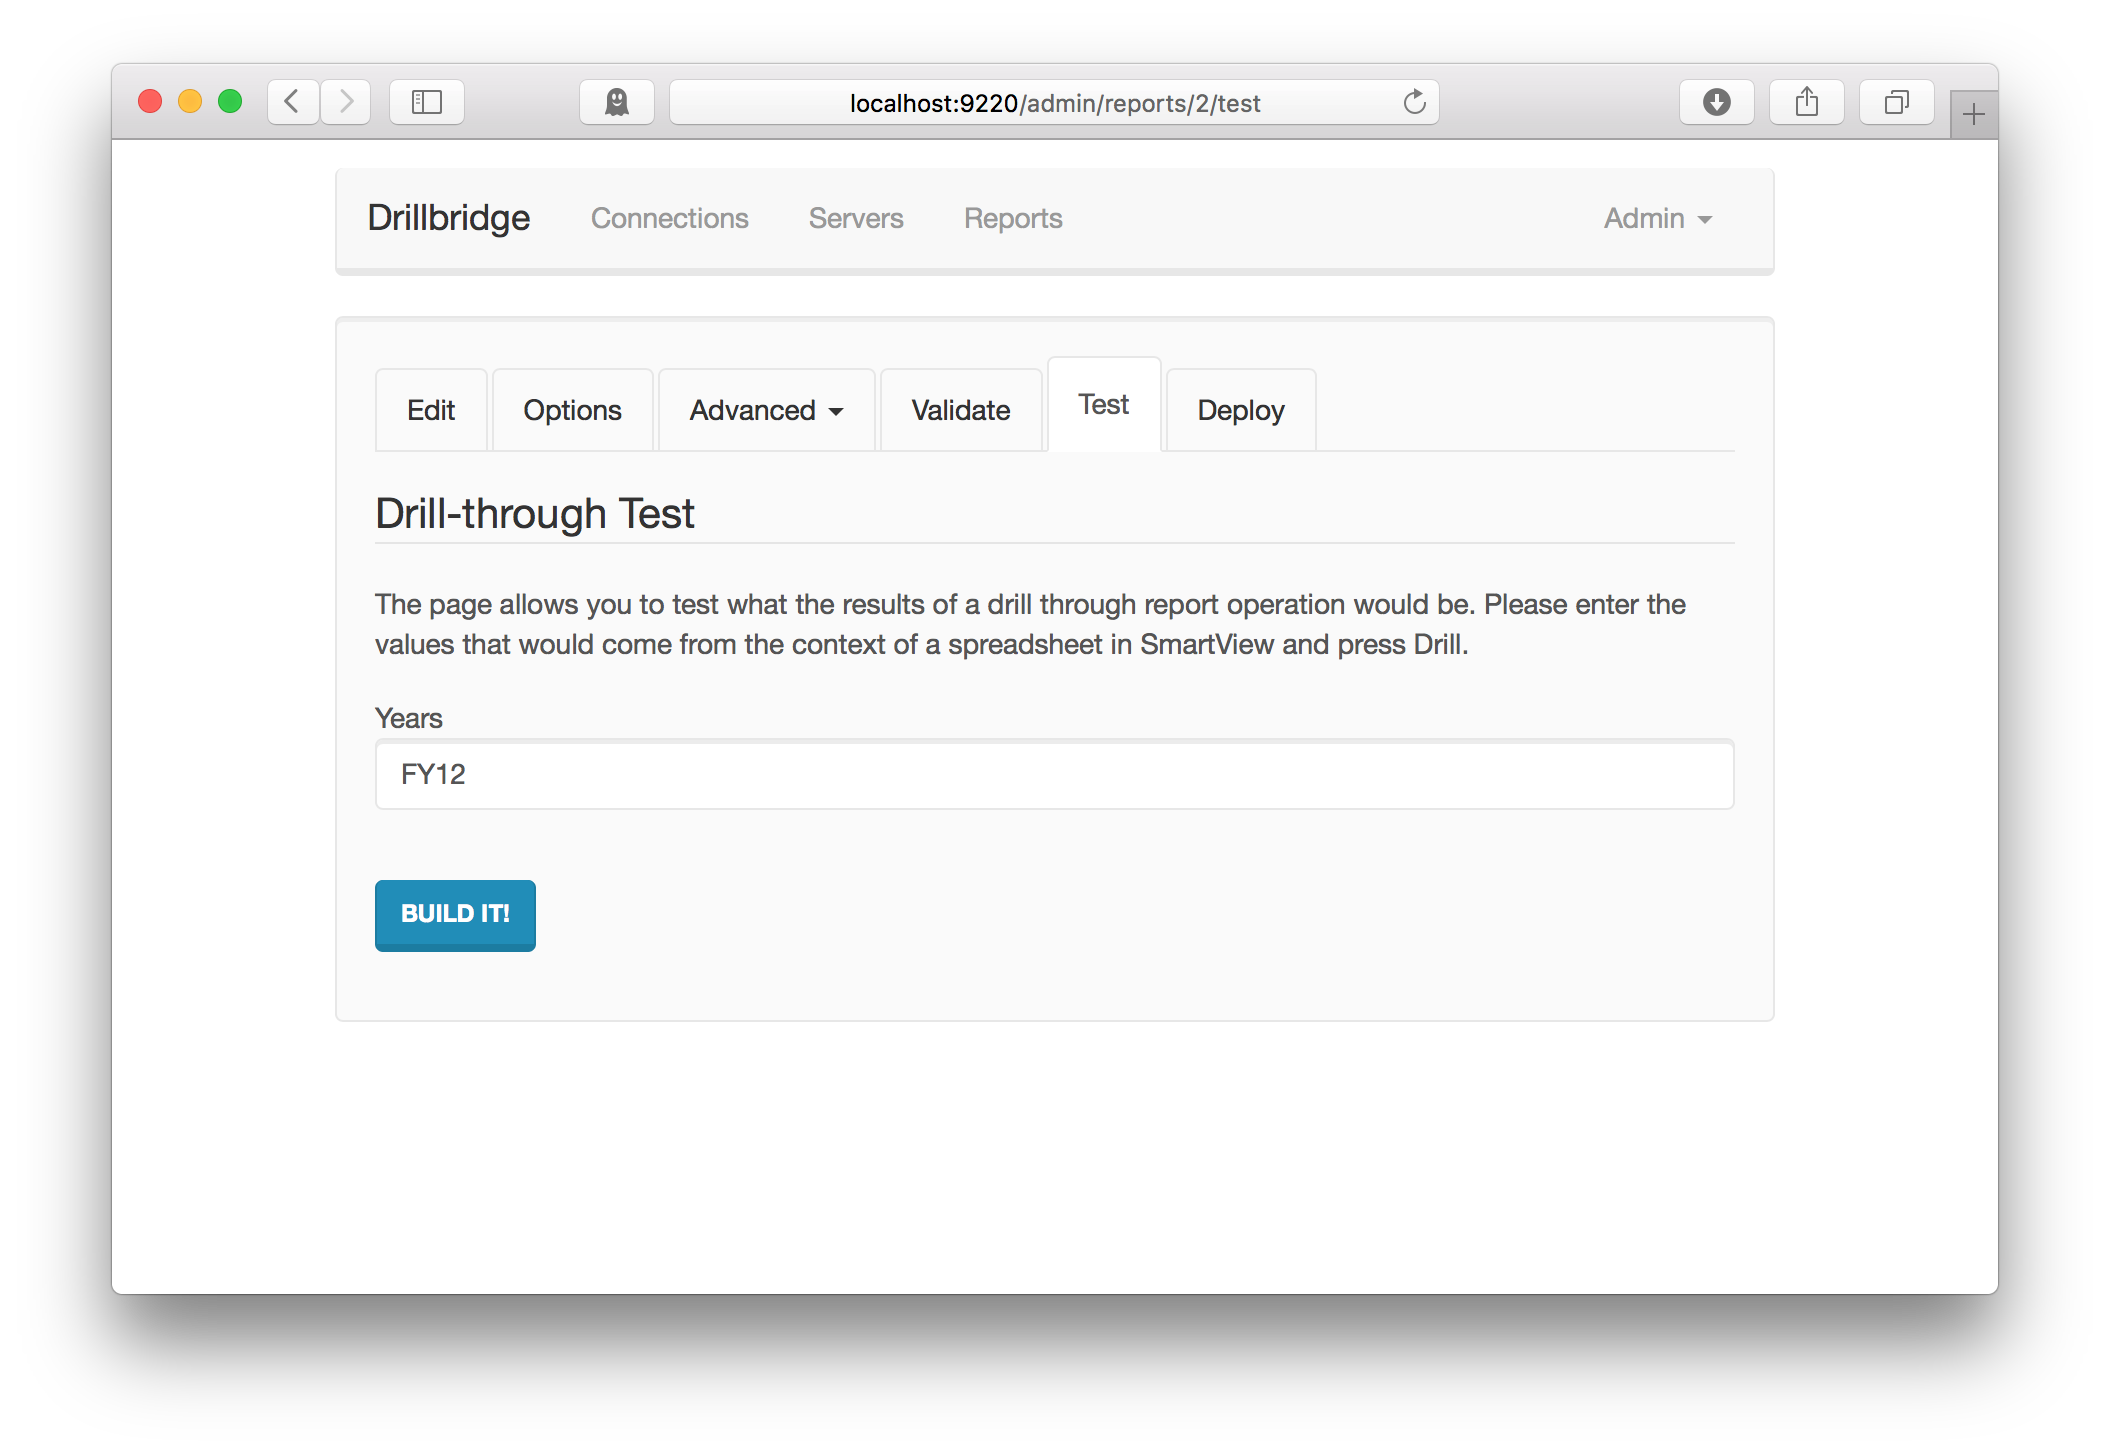
Note that for readability I have broken the token up across several lines. This works just fine in the latest versions too and is a nice way to increase readability. Let’s see what this query generates by going over to the Test screen:

drillbridge-drillable-columns-testing-source-query

And building the report:

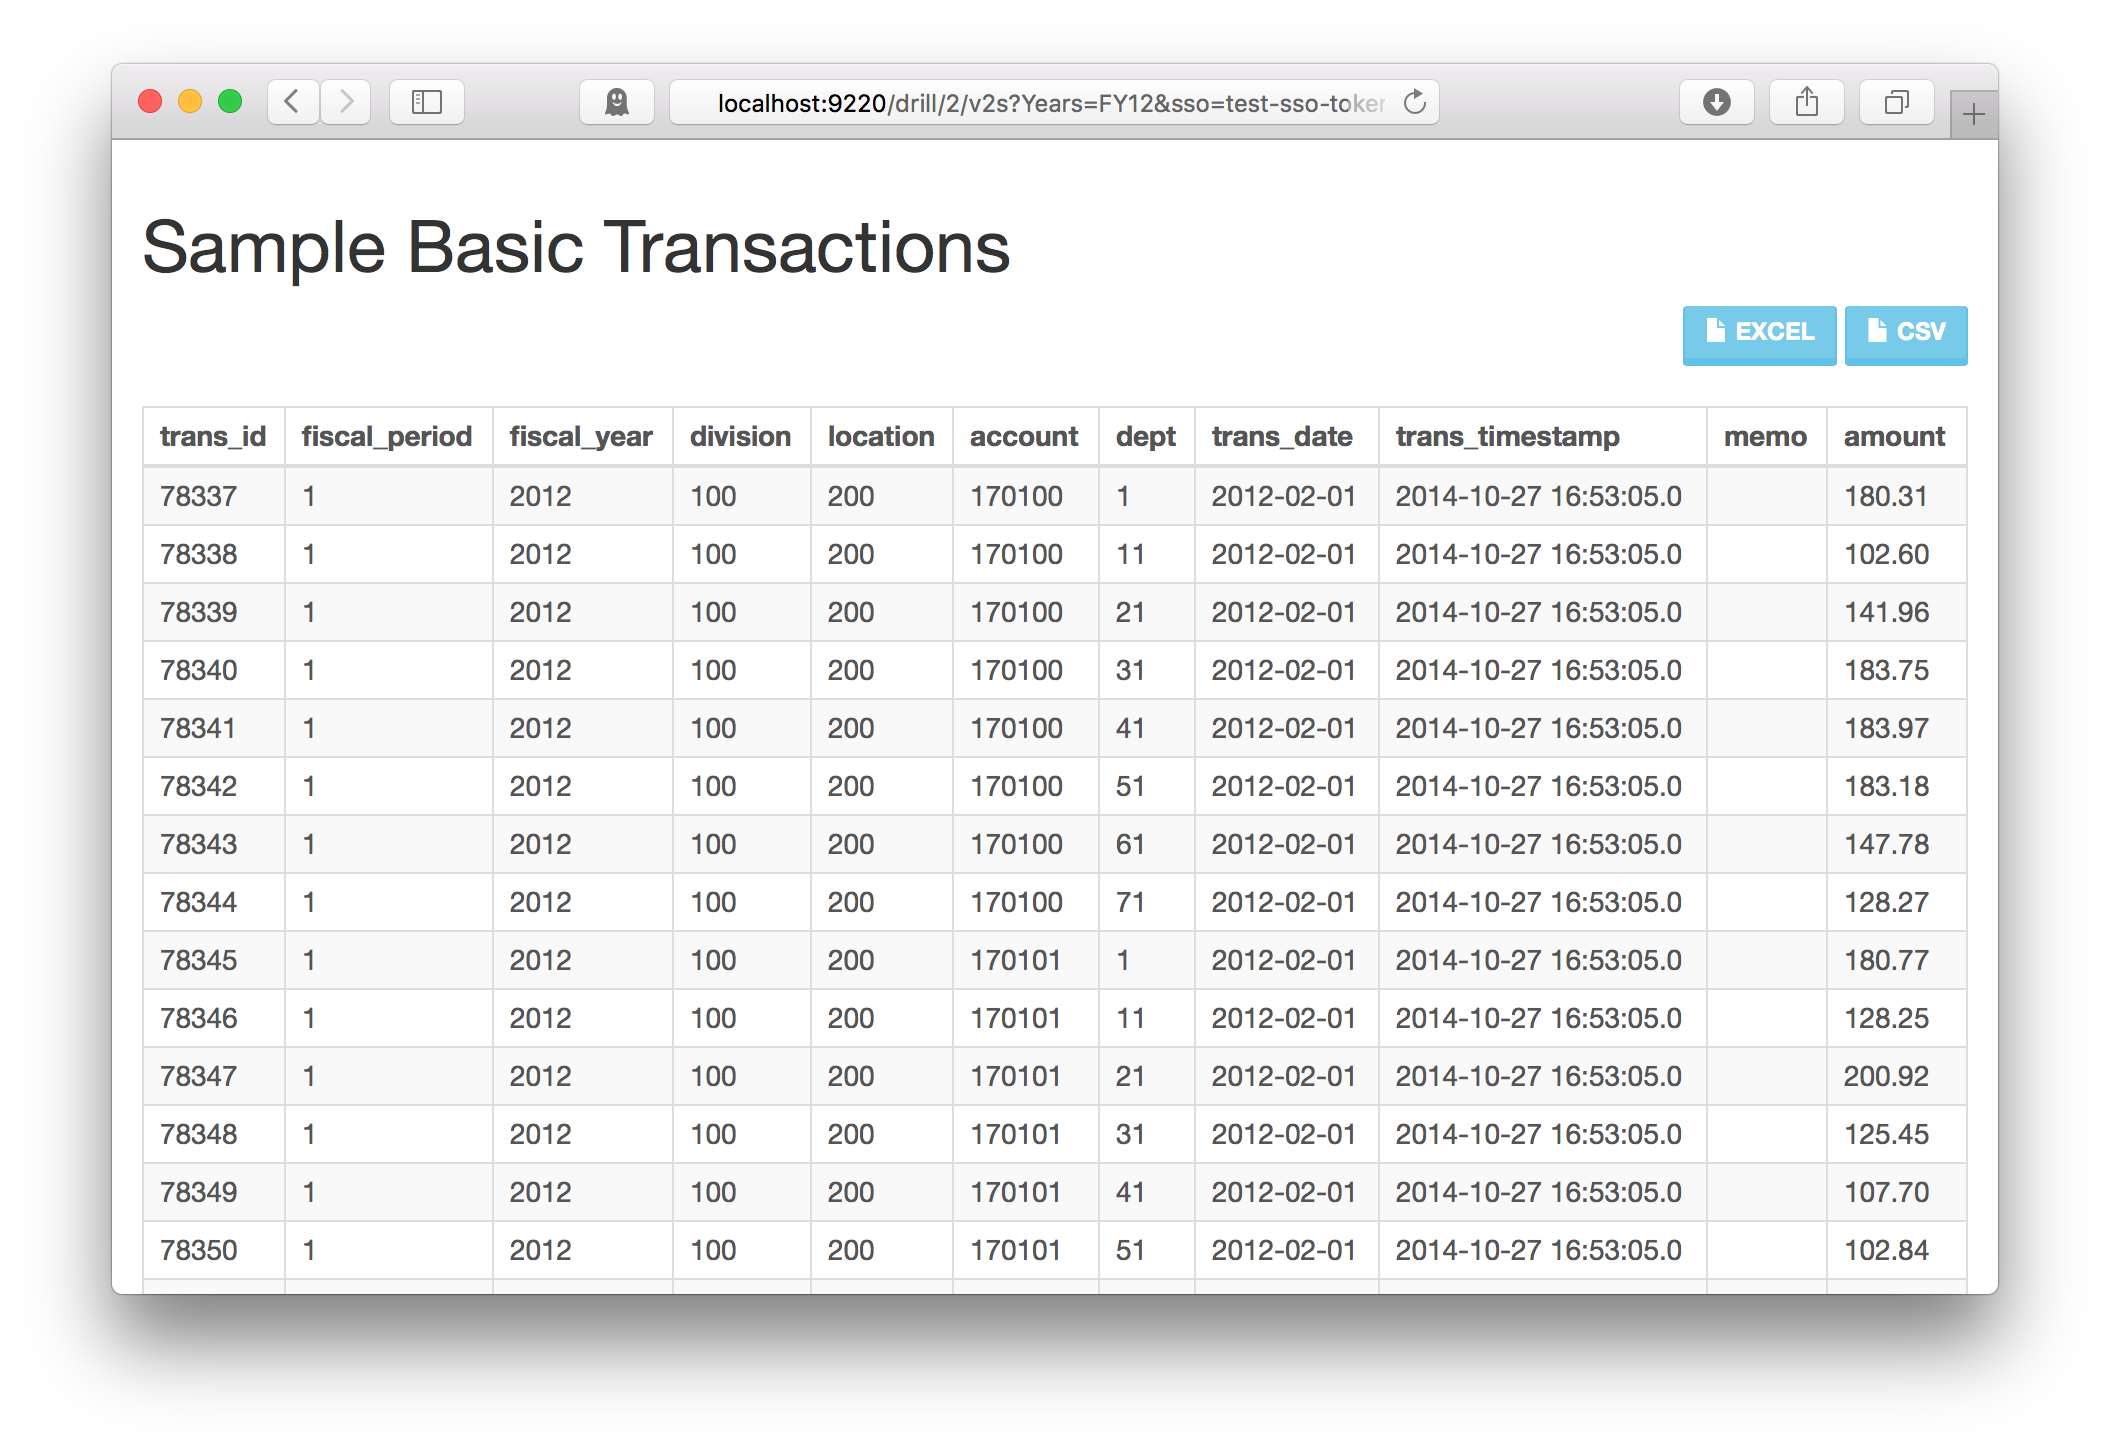
drillbridge-drillable-columns-source-query-data

Everything looks good so far – note that the drillable column hasn’t been setup yet so we shouldn’t be expecting any special links to appear yet.

Now let’s create a new report definition. This new report type will be a special report type known as a “Forwarding Link Report”. If you think about a normal Drillbridge report, it builds a SQL query by taking the POV and plugging it into a template. A Forwarding Link Report works in much the same way, except instead of building a SQL query, it builds a URL and forwards the browser to it.  In this case I’m just going to build a simple link over to Wikipedia since they have a nice simple URL structure that is good for illustrative purposes.

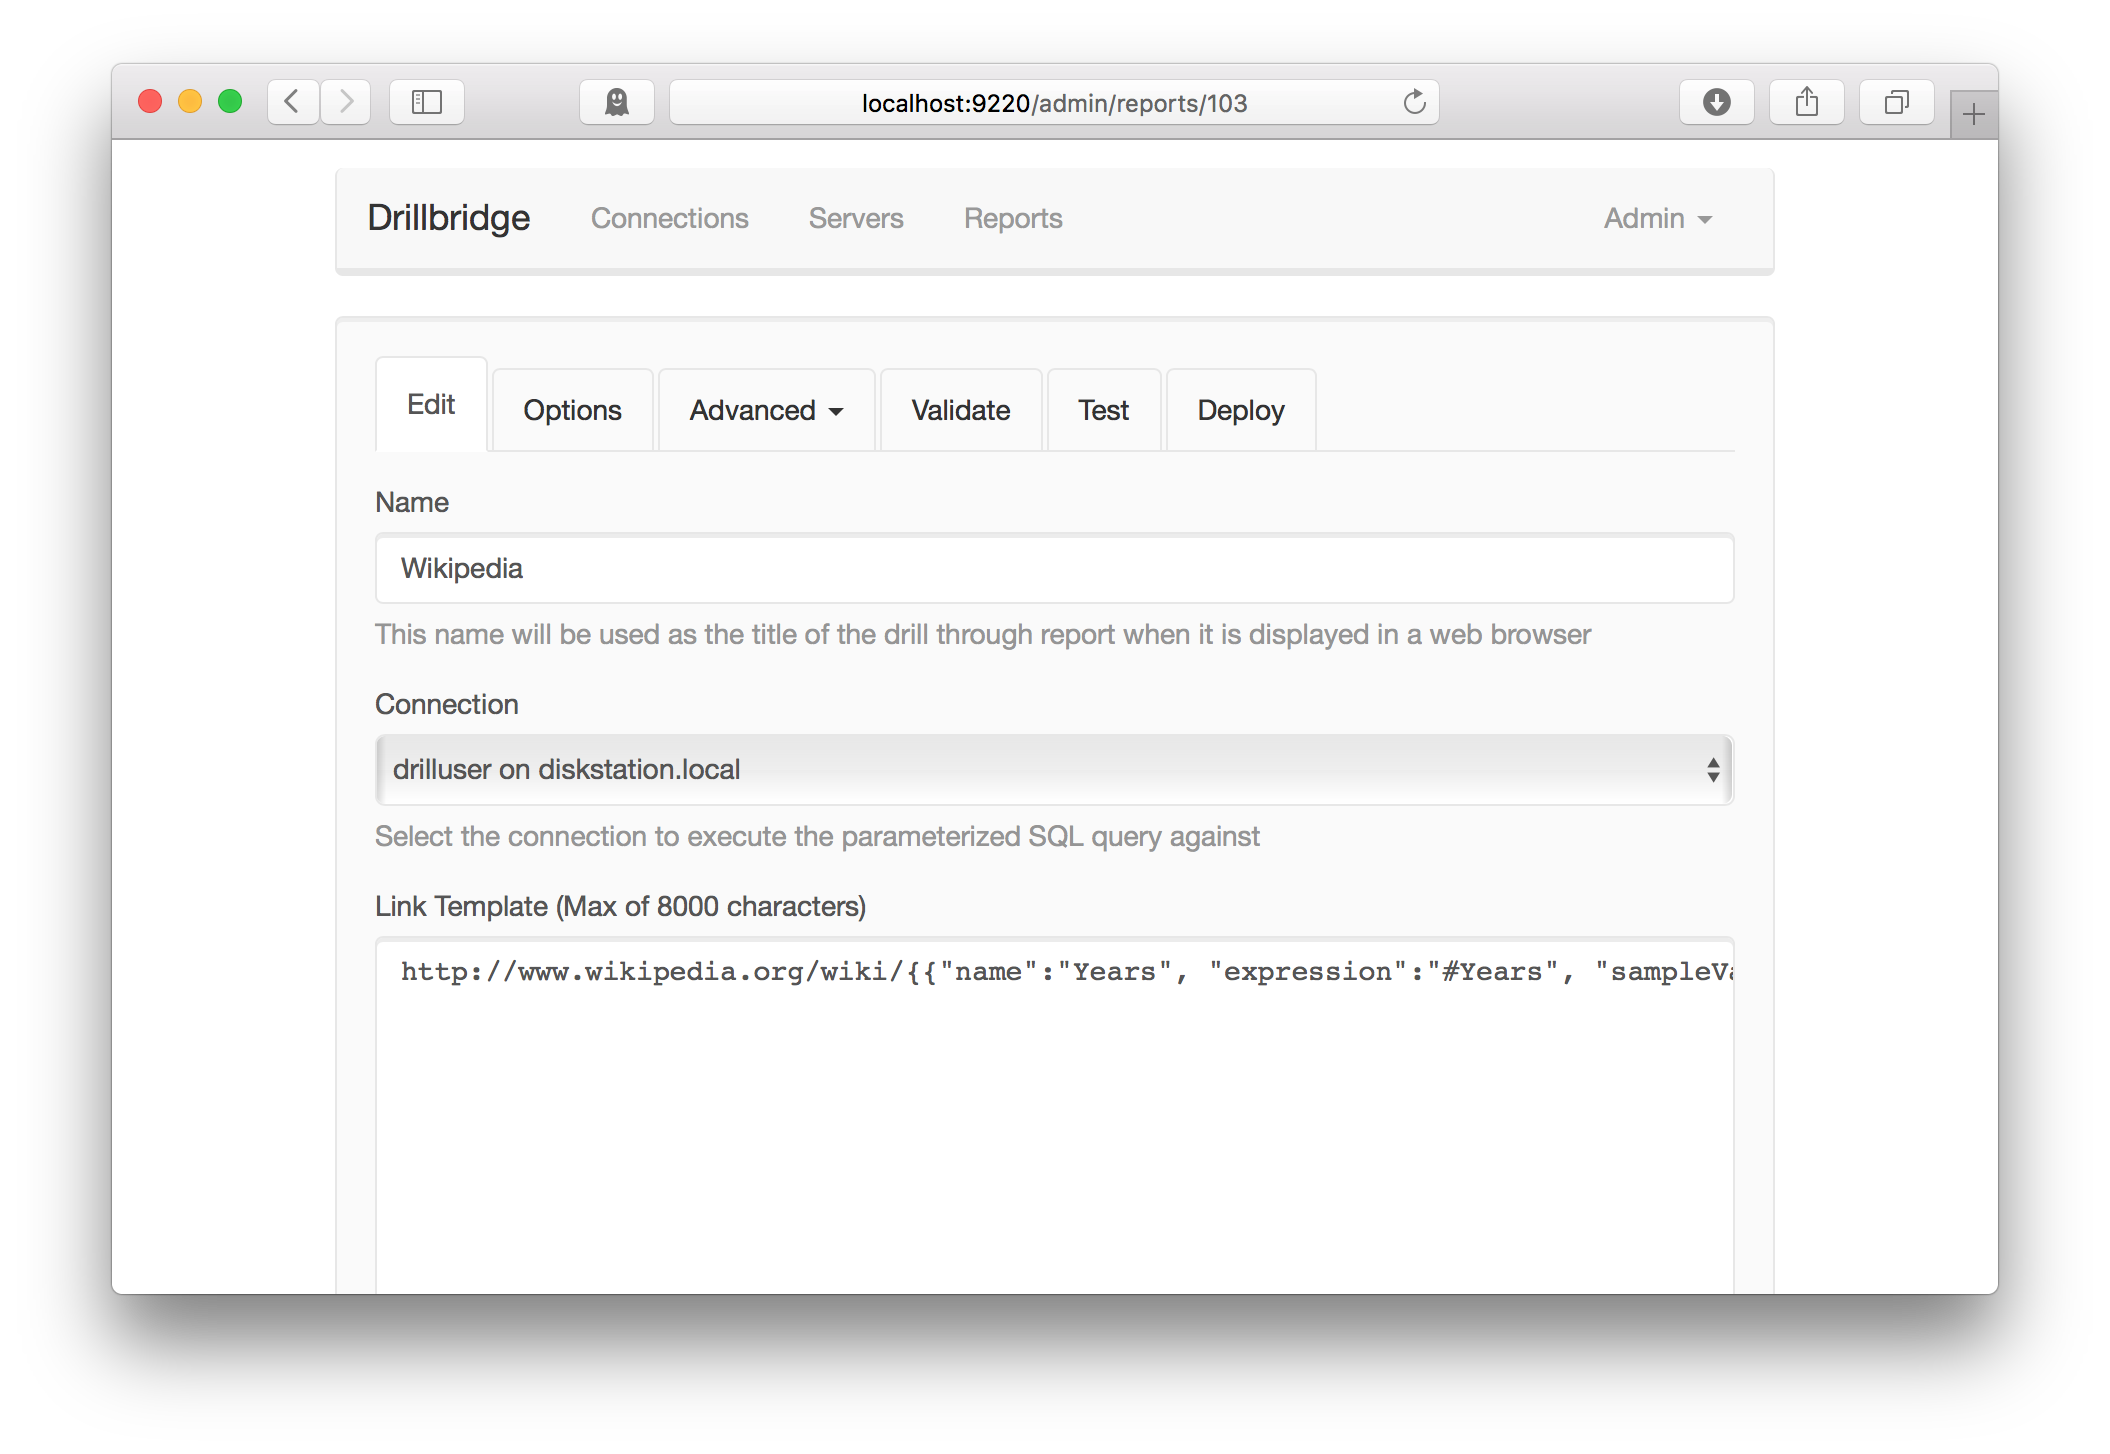
Here’s our link definition:

drillbridge-drillable-columns-link-query

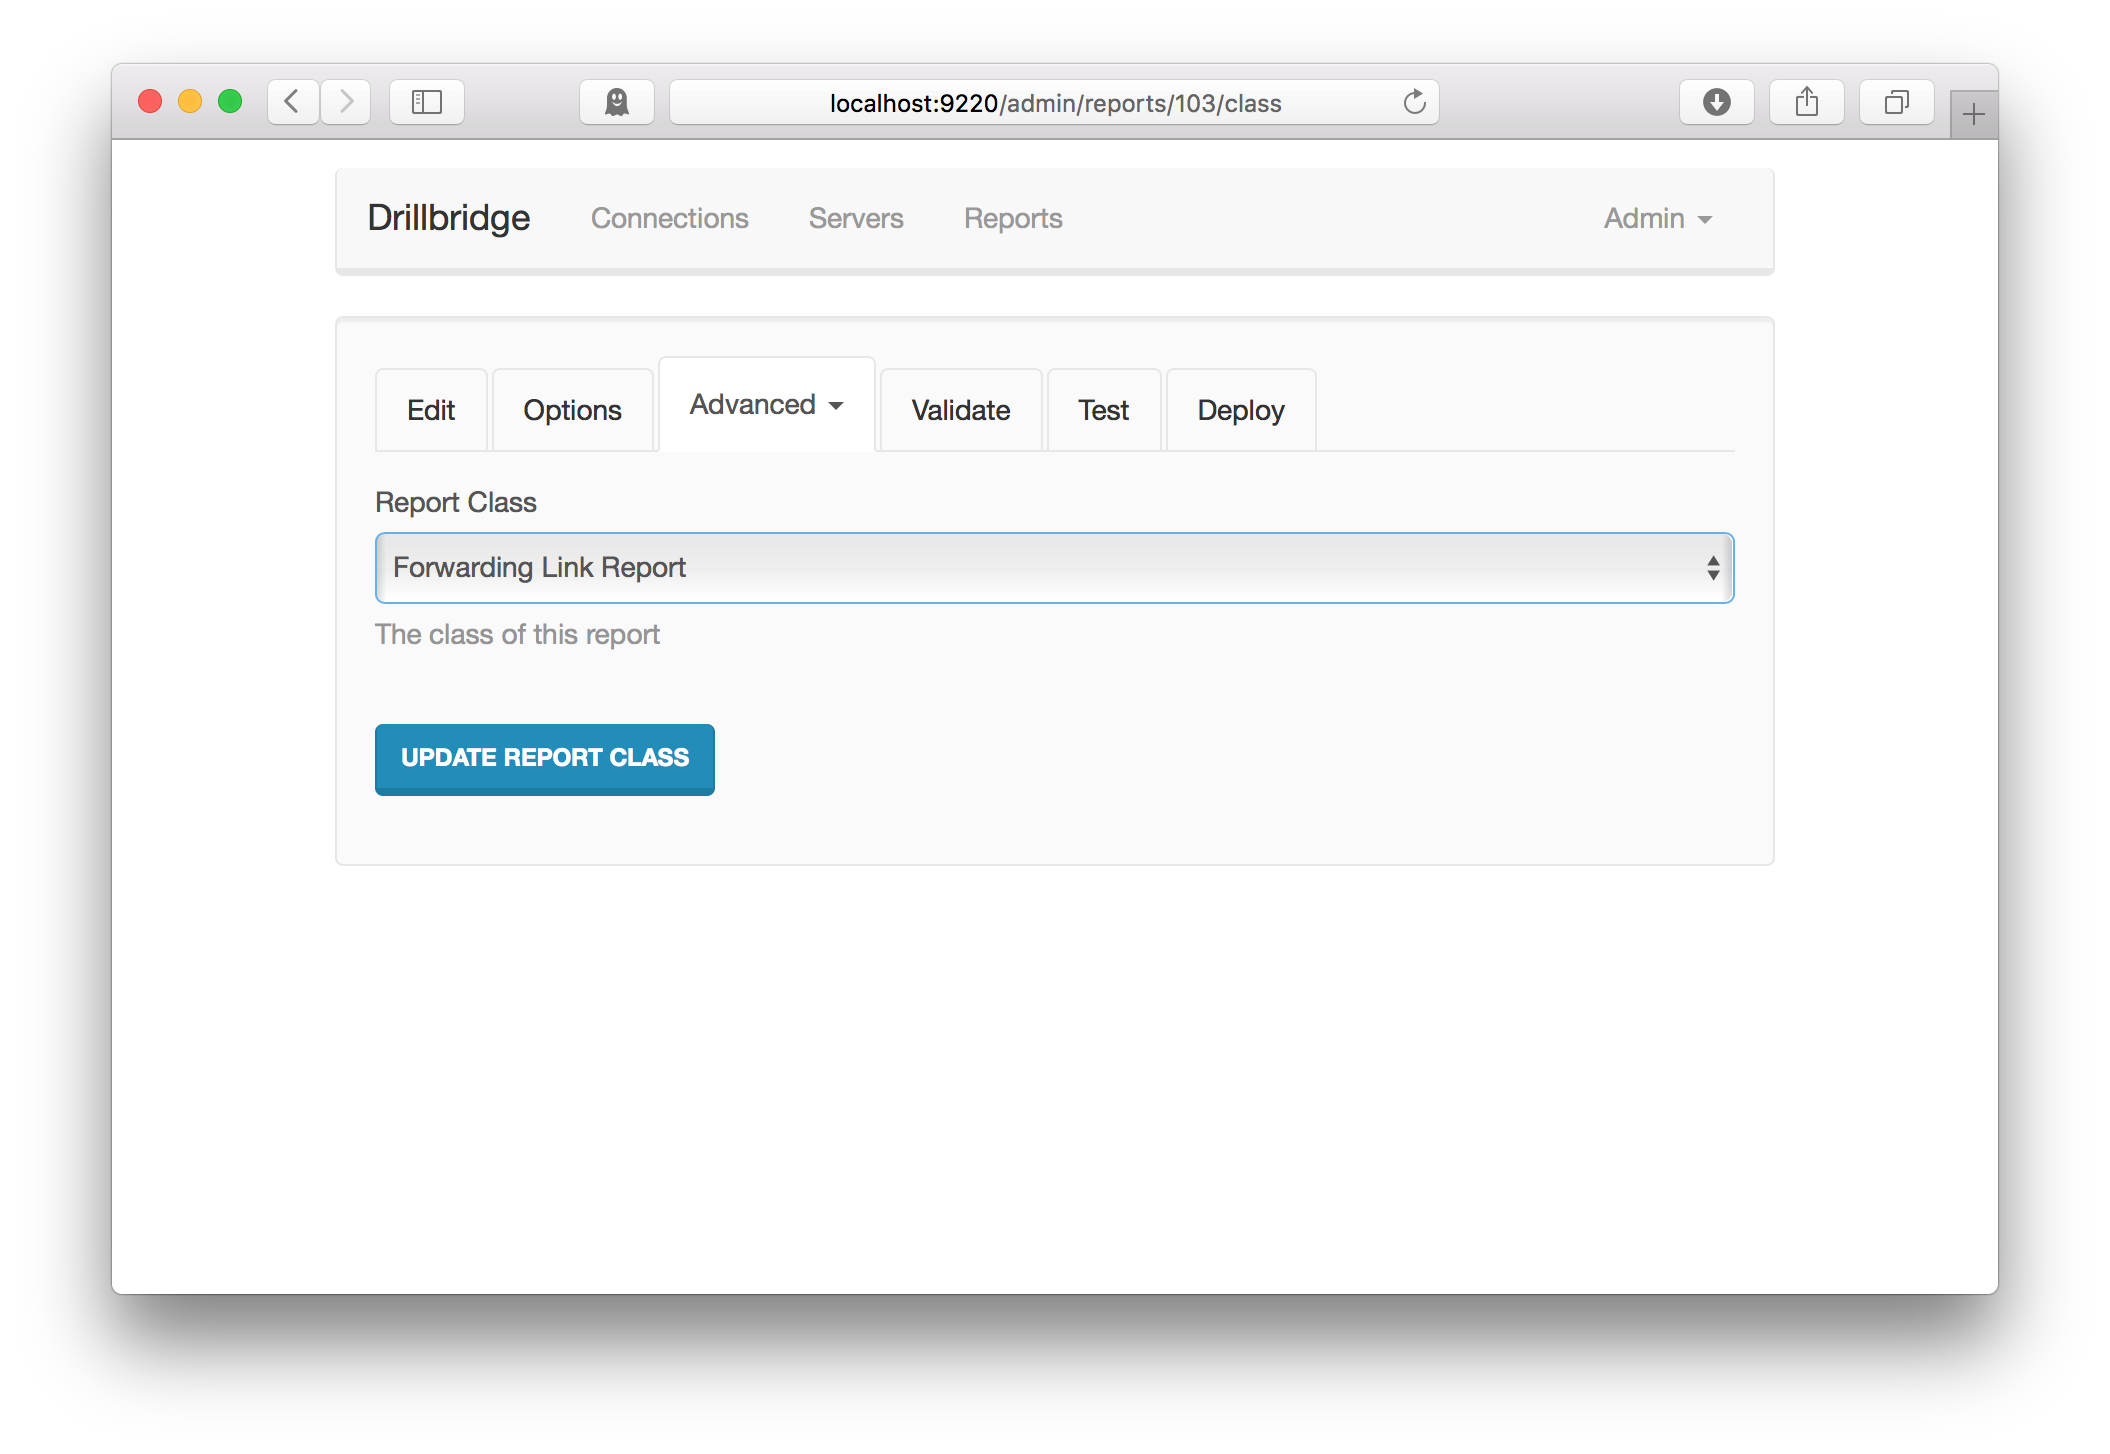
Note the label above the text box for editing the link definition. Instead of saying it’s a SQL query, it refers to it specifically as the Link Template. This is because the report type itself has been changed (which is needed to make this type of report work). To change the report type we go to the Advanced menu and the click on Class, bringing up this editor:

drillbridge-drillable-columns-target-class-type

Note that in this case, the types available are JDBC drill-through report (the typical report type), Forwarding Link Report, or MDX report (yes, Drillbridge can execute MDX queries too!). The Drillbridge report system is completely modular and developers can add their own report types using a simple Java plugin.

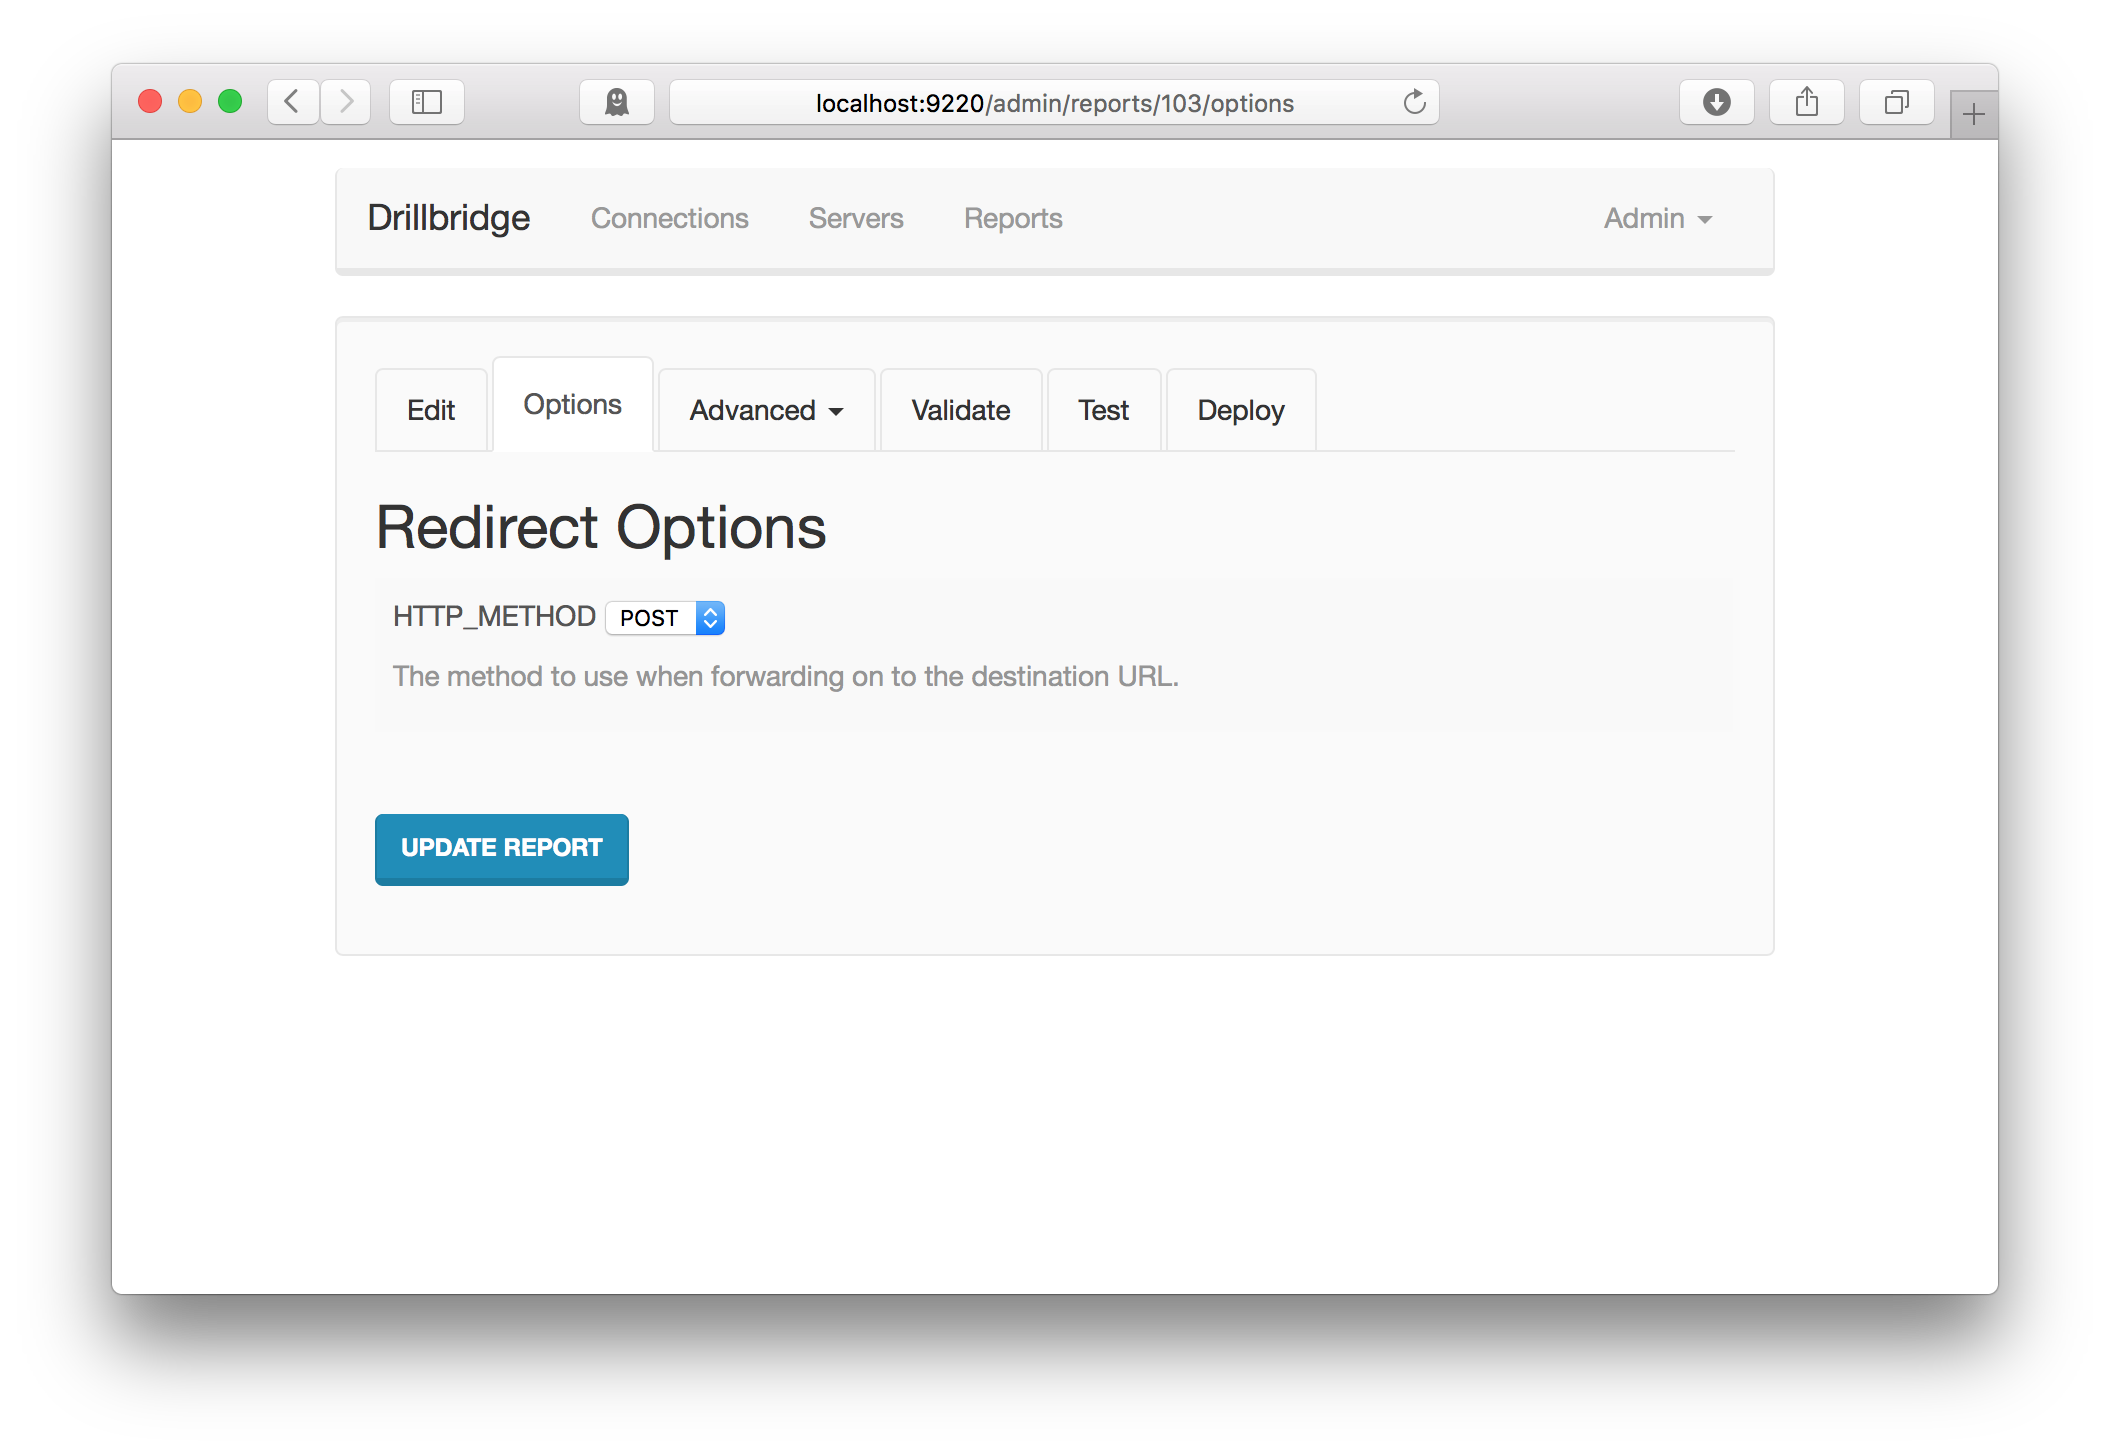
Custom report plugins can also easily “advertise” their available options to Drillbridge so that Drillbridge can provide a nice UI for configuring them. For example, in the case of the forwarding link report, there is just one option available (as opposed to the 20 or so options available on a typical report) that let’s us choose the HTTP “verb” type to use:

drillbridge-drillable-columns-link-options

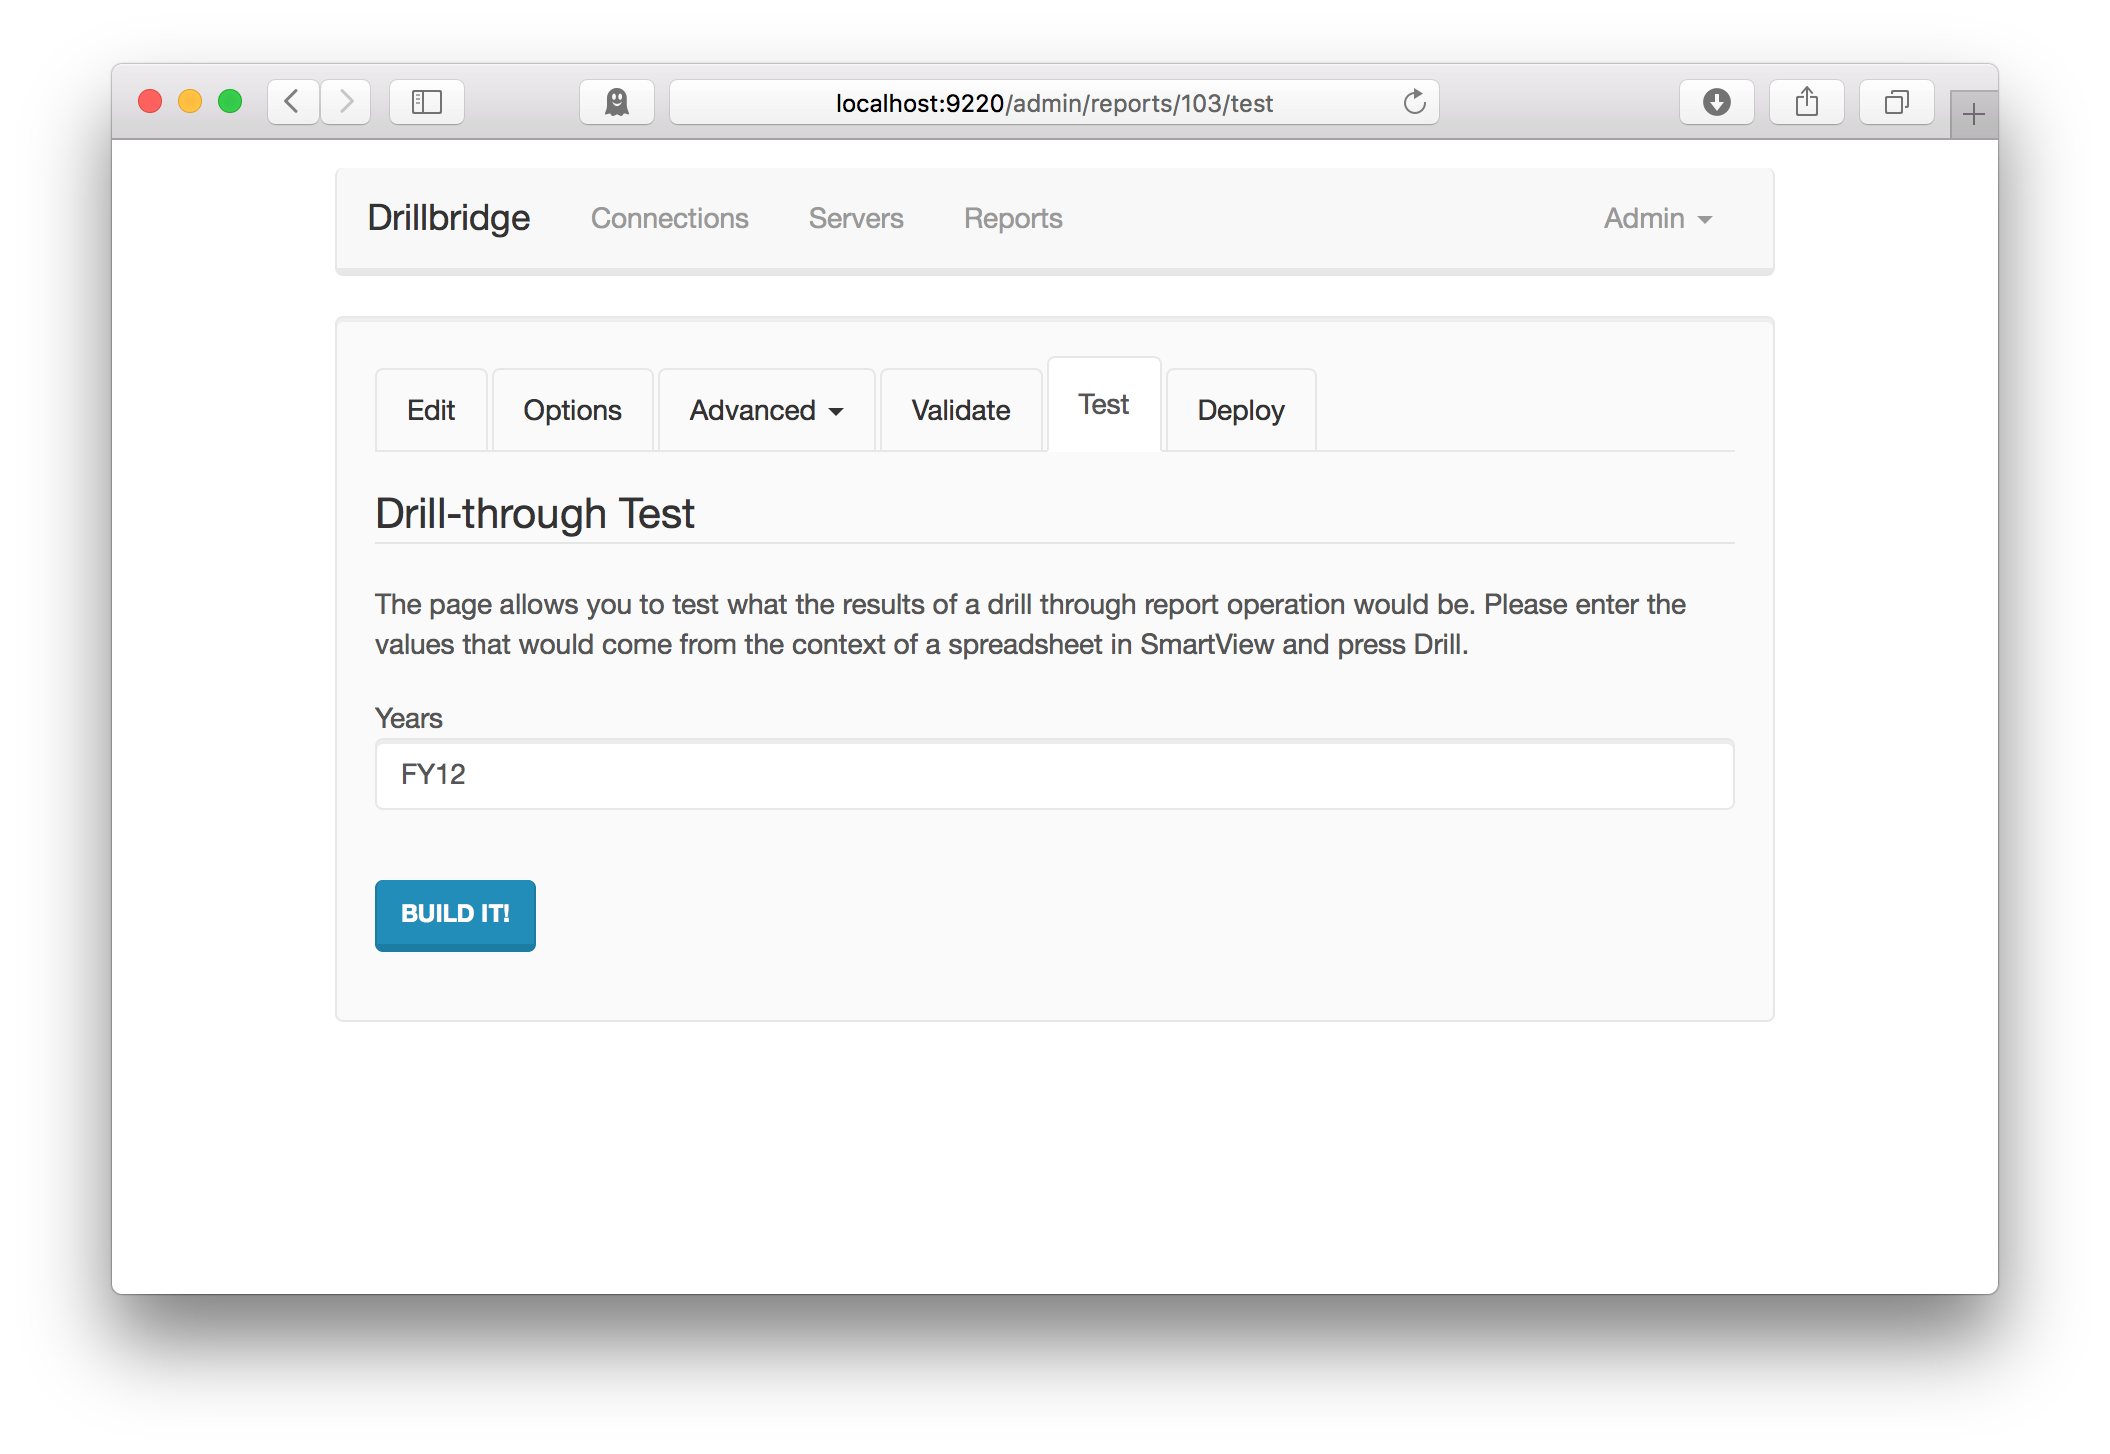
Let’s head over to the Test tab for this new link report and see what happens:

drillbridge-drillable-columns-testing-link

Let’s build it and see what happens:

drillbridge-drillable-columns-link-wikipedia

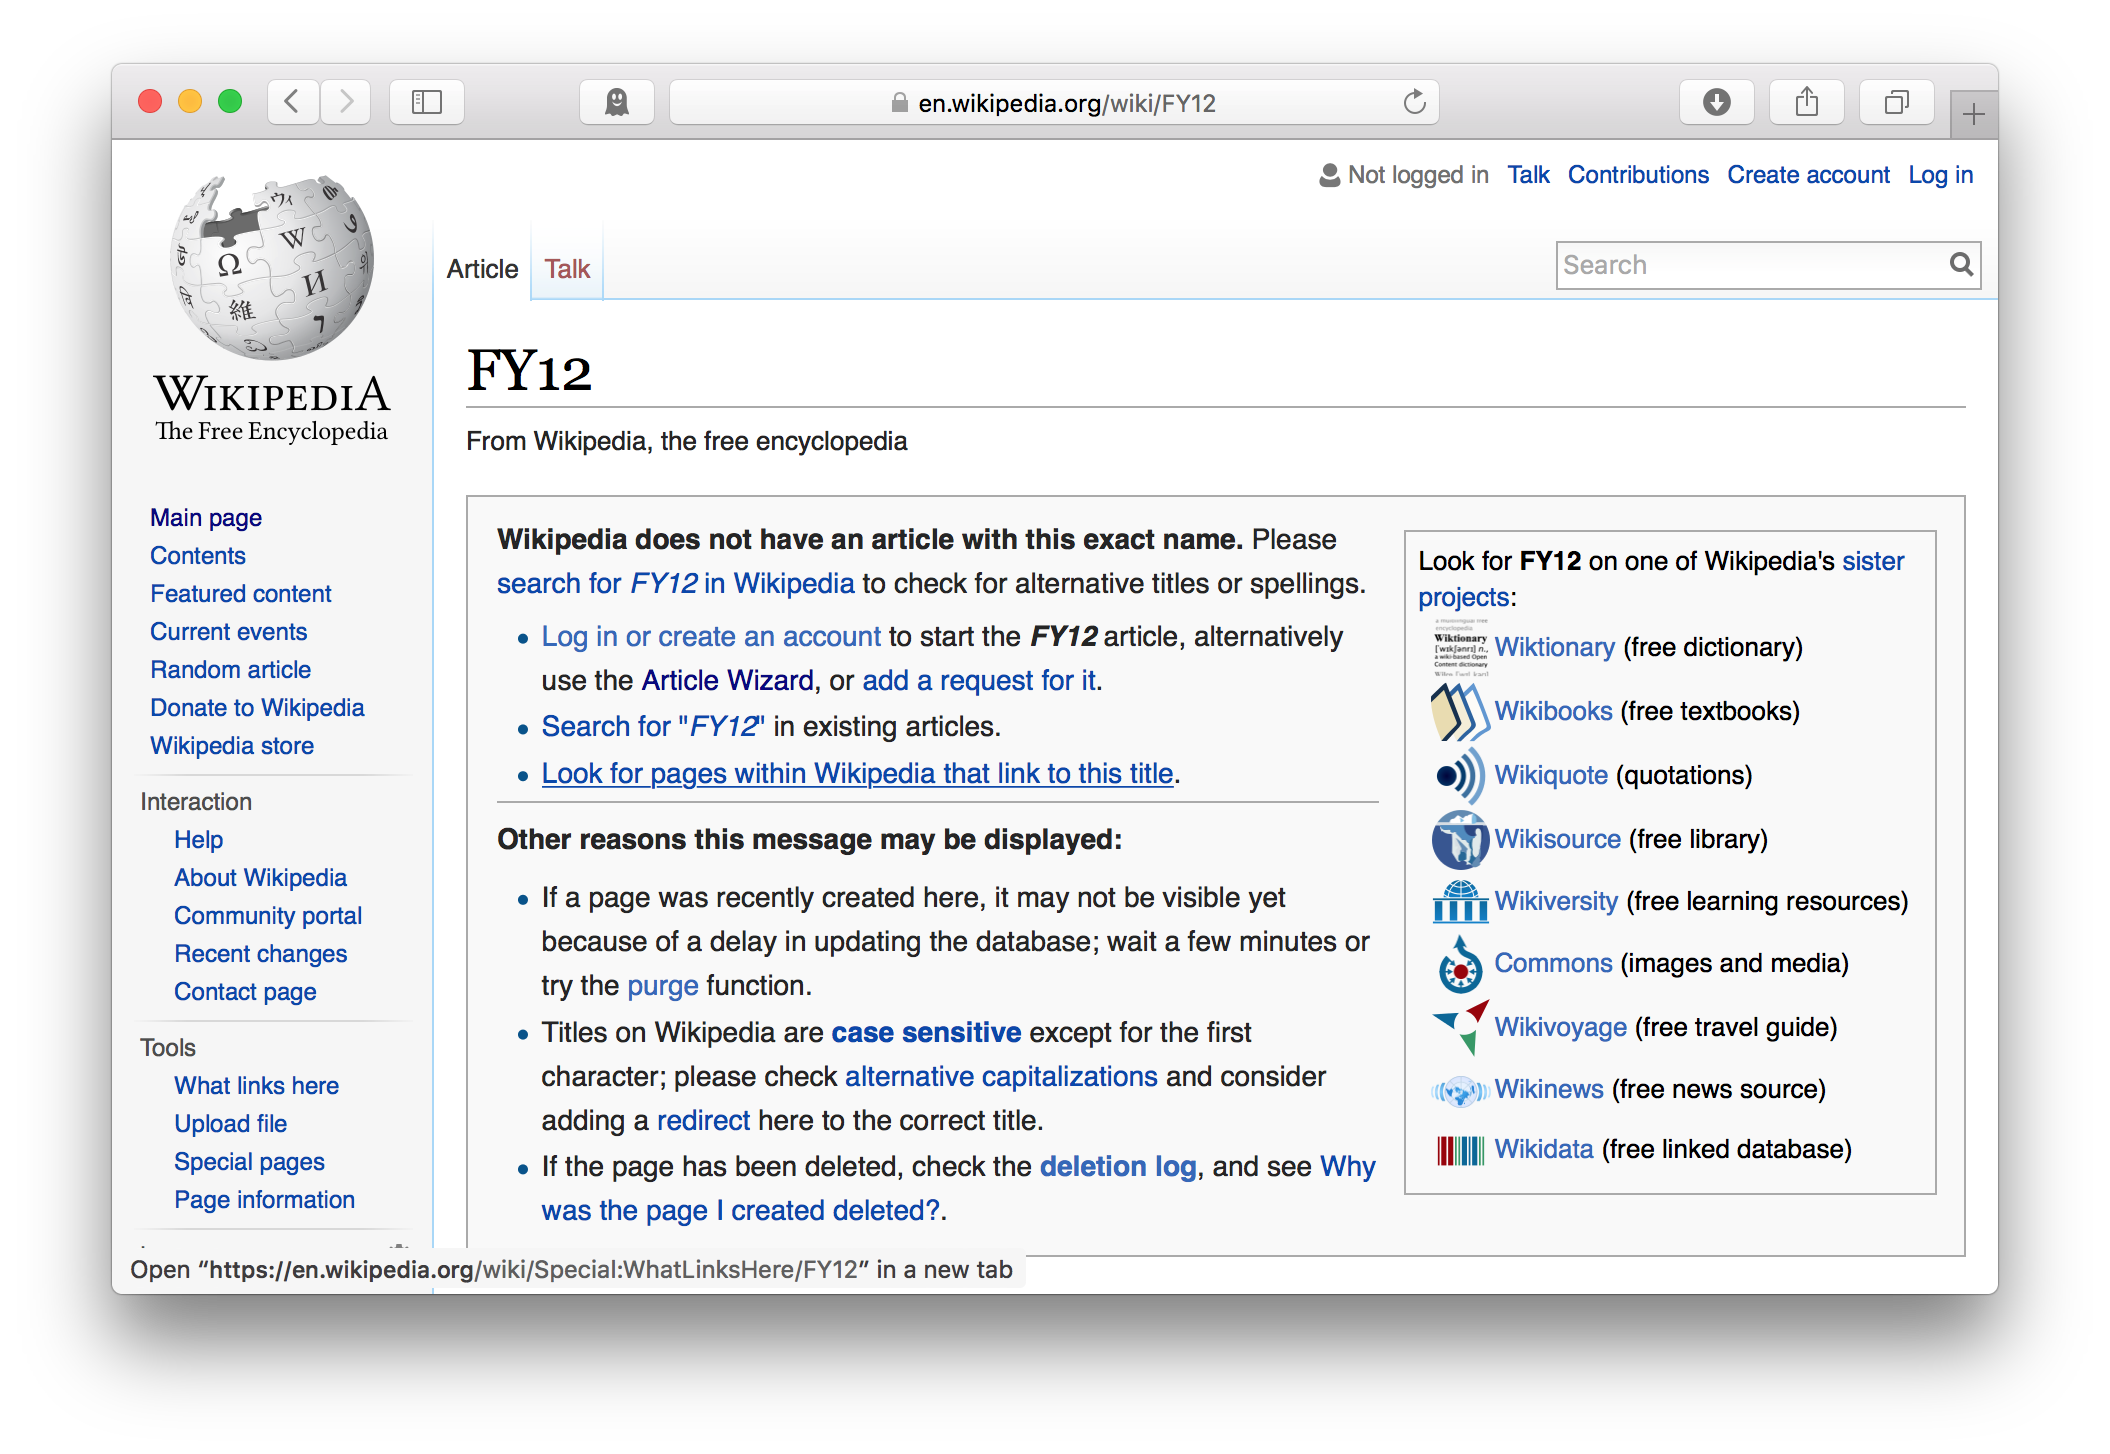
As expected, the given input was used to build a link and our browser was redirected there immediately. This is one of the nice things about doing drill-through in a web browser: you can do pretty much anything you want.

Now, what we’d like to do is make one the columns in our first report drill over to the results of this new link report we just setup. To do that, let’s go back to the original report, then go to the Advanced menu, then Drillable Columns:

drillbridge-drillable-columns-drillable-columns-list

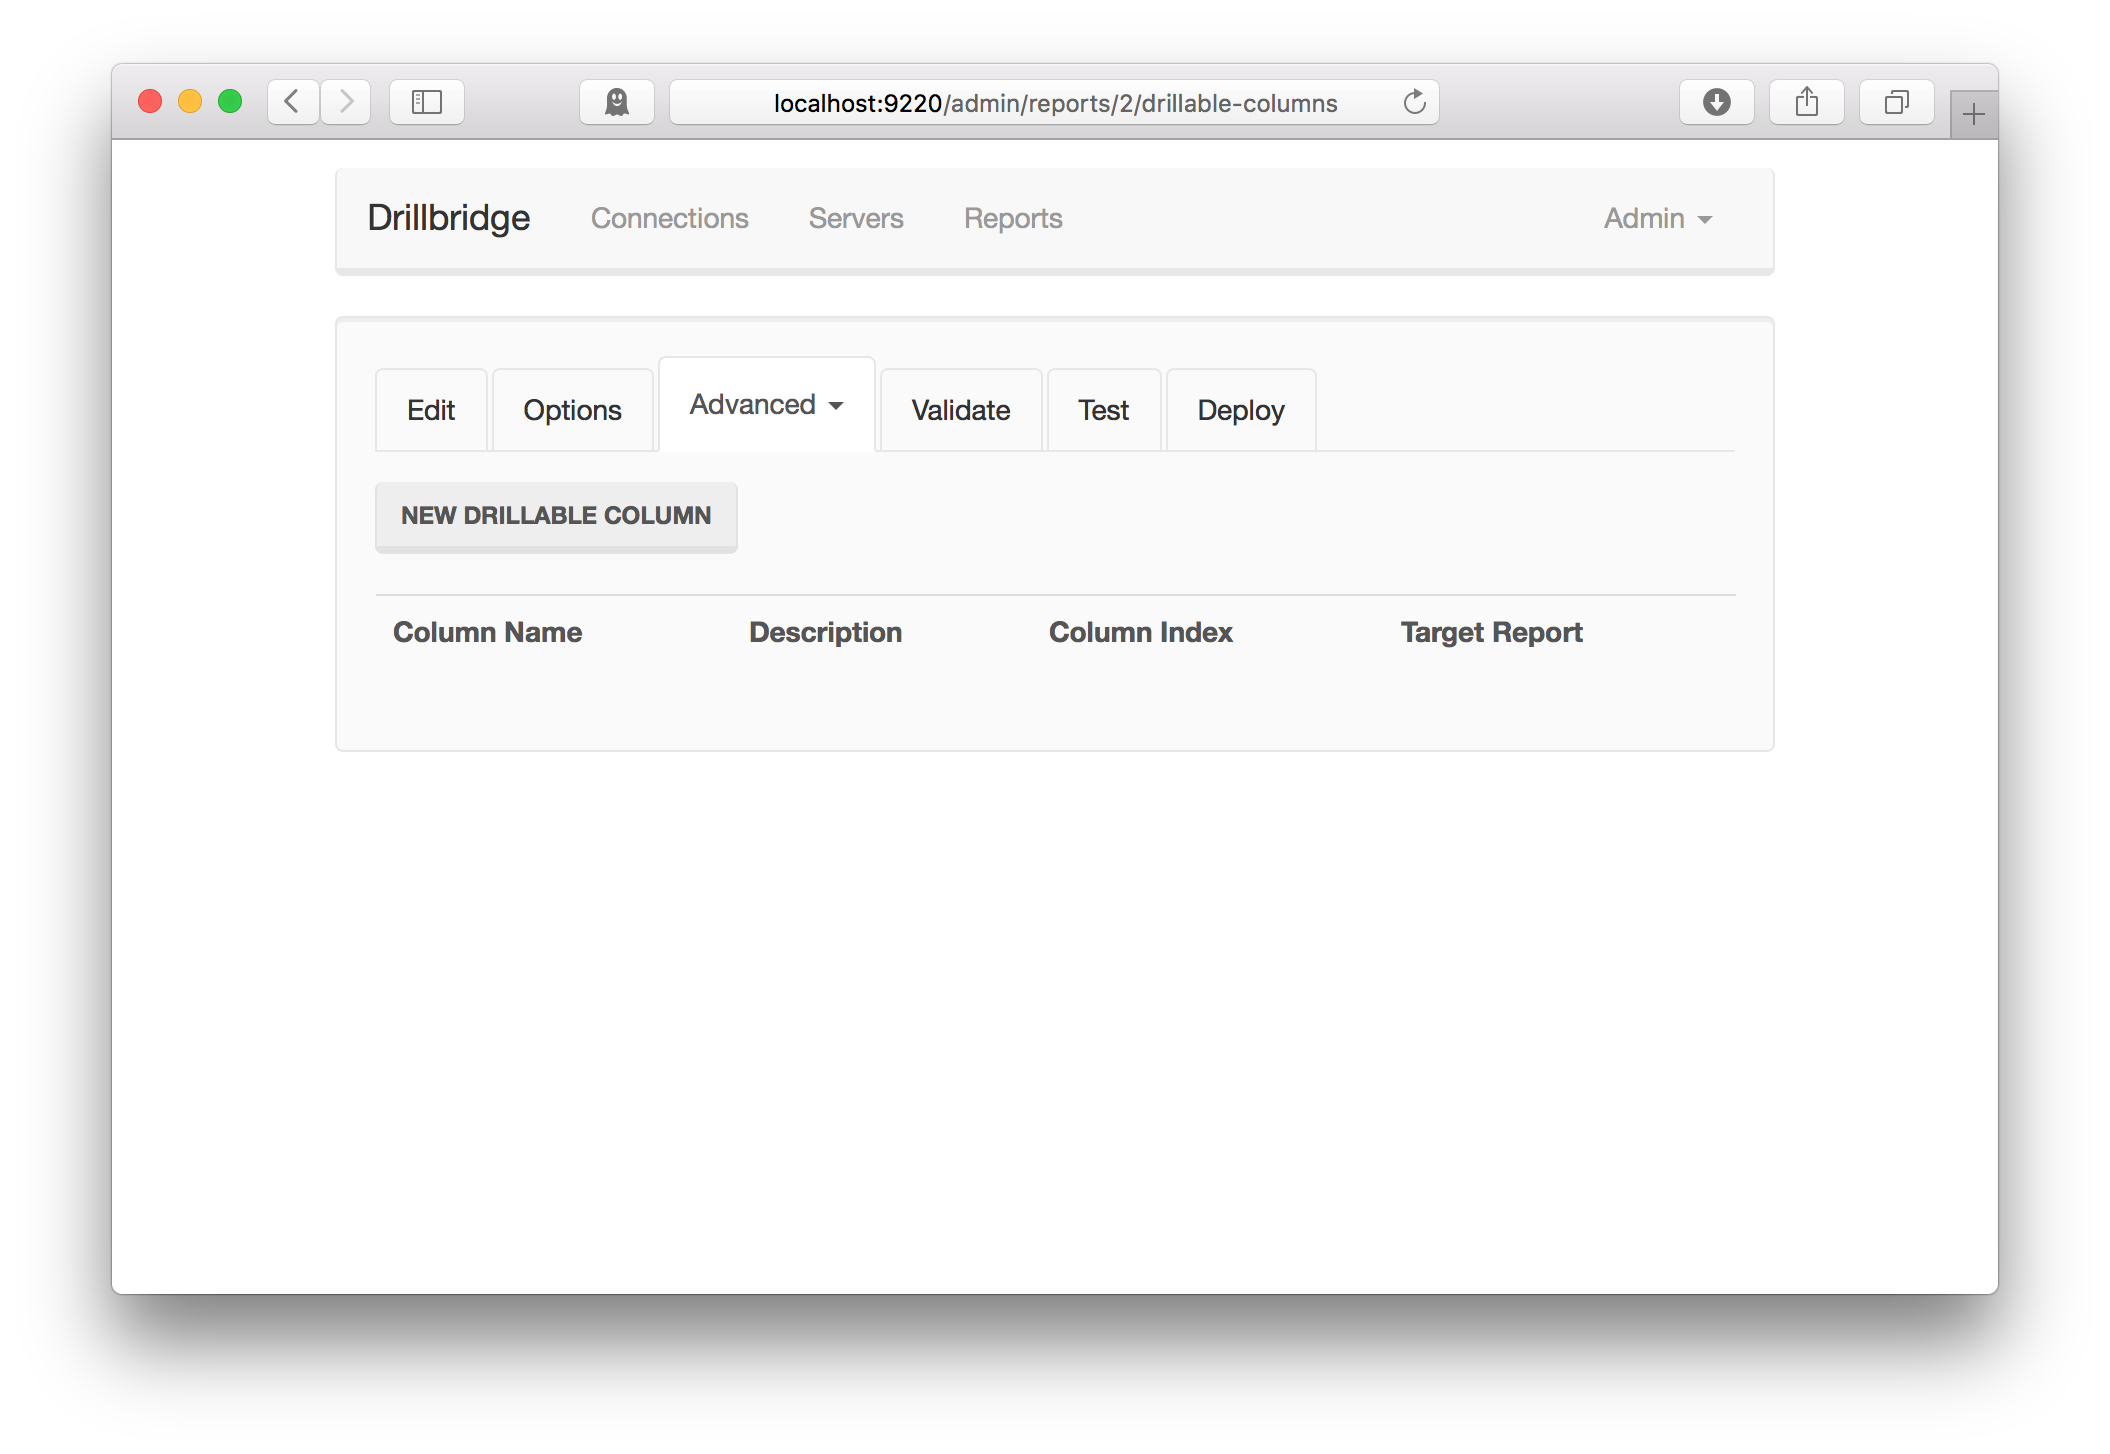
Then click on New Drillable Column. The editor will be brought up:

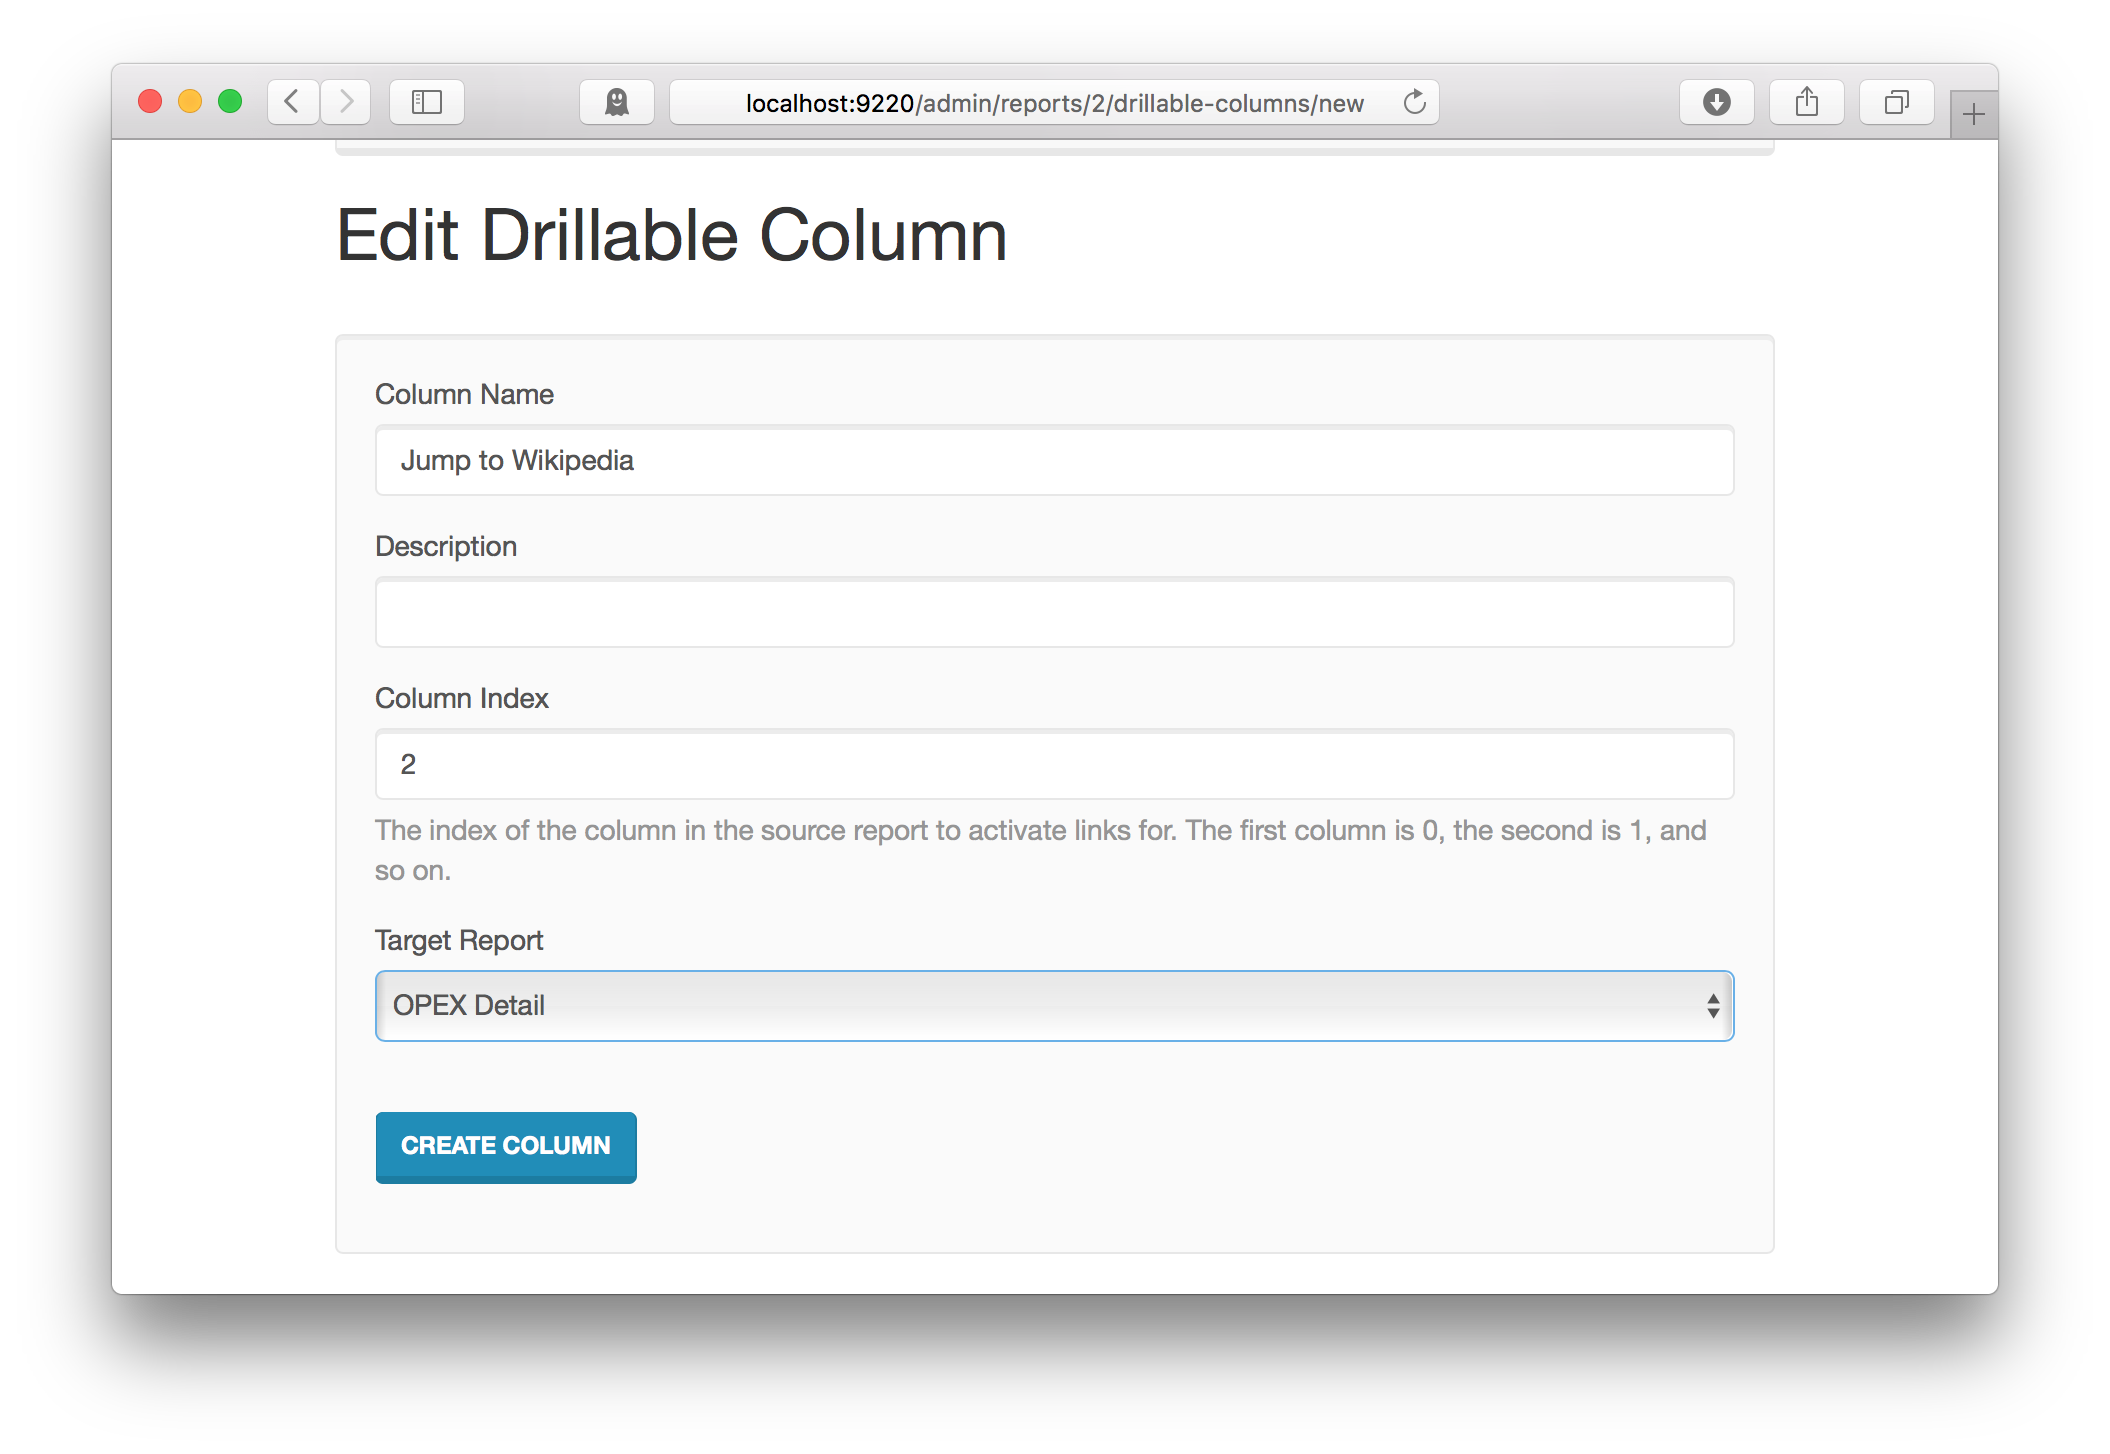
drillbridge-drillable-columns-editing-column

Here we have a chance to give this drillable column a name, tell the report which column should be drillable, and then choose the target report. We can put in anything we want for the name. What’s important in the column index and target. The column indices start at 0 for the first column and then count up. In this case we want the third column to be a link, so this is column index 2 (0 = first column, 1 = second column, 2 = third column, etc.). Then we select our new report as the target report, which I named “Wikipedia”.

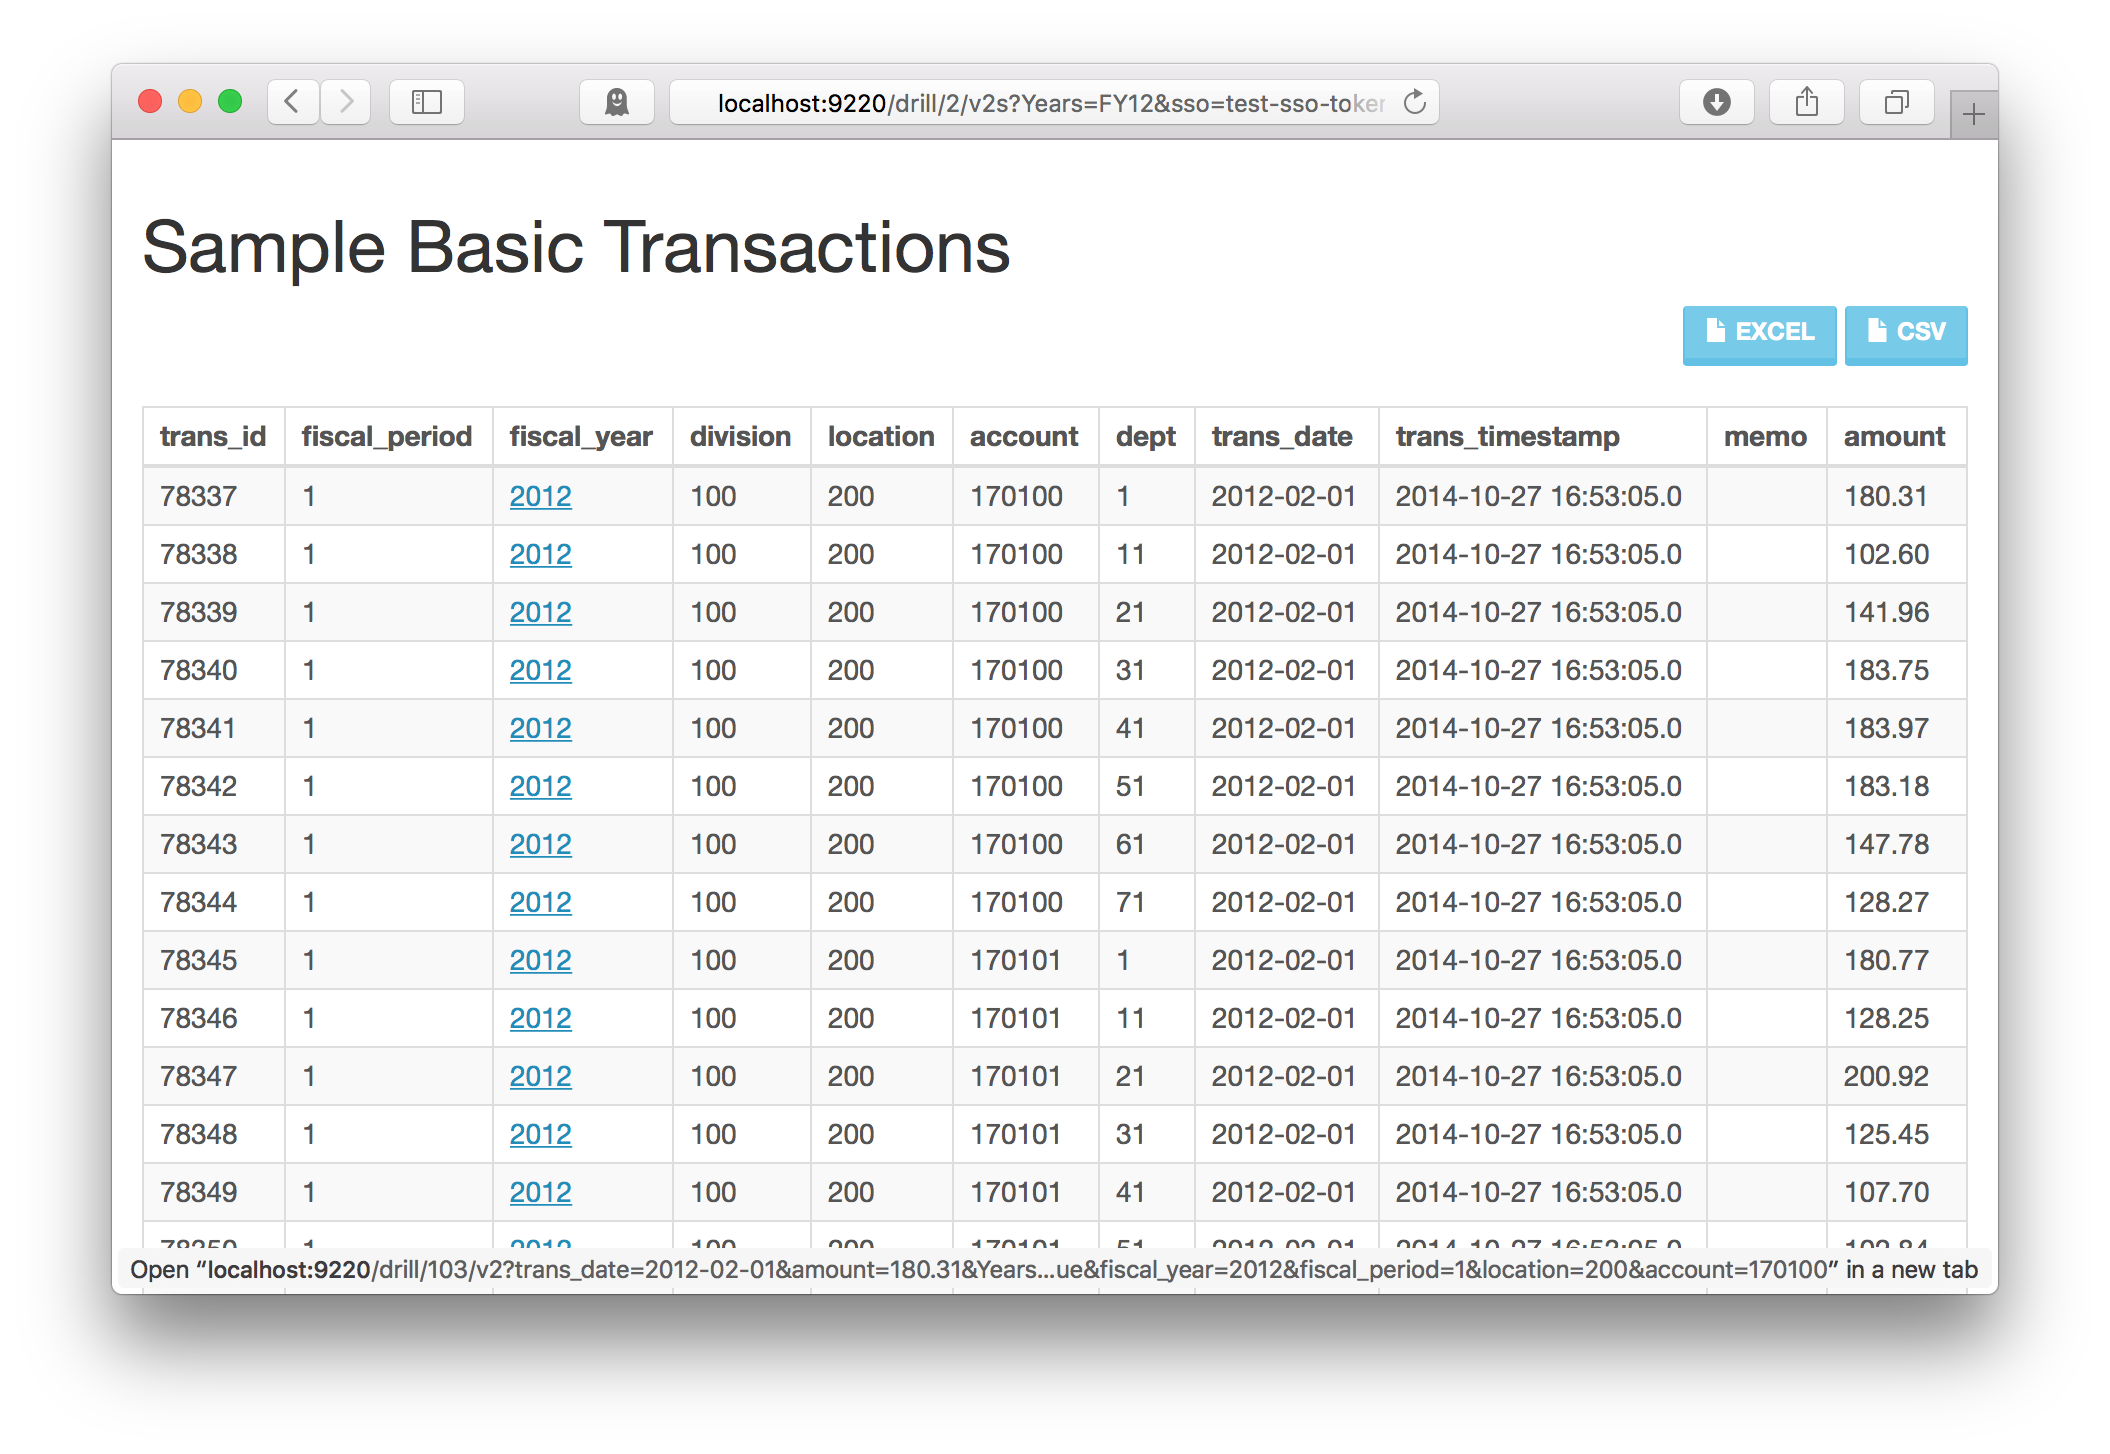
Let’s go and test this source report again and see that the third column has links now:

drillbridge-drillable-columns-viewing-drillable-column-links

And sure enough, clicking on one of the links brings up the Wikipedia report – which doesn’t bring up a report at all, per se, it just executes the report, which uses the POV to build a URL and automatically redirect the web browser. That’s it!

Report POV vs. row POV

It’s important to consider what the POV handed to our target report will be. The POV is actually the combination of two things, out of necessity: the POV of the source report merged with the POV of the row itself. Whereas the normal report POV might be something like Scenario = Actual, Year = FY12, Time = June, the POV handed to the target report will be all of those things, plus keys and values from the current row. For example, if the original report only considered a given account but showed details for transactions, and there was a column called TRANSACTION_NUM, then the POV would also include a key named TRANSACTION_NUM with a value of whatever the value from that row is. This is critical for users that want to link to something or execute another query using data from the row.

Drillable Columns is one of my favorite features of Drillbridge because it’s so easy but powerful, but more importantly, it saves people time, and that’s what Drillbridge is all about.