Earlier this week I looked at setting up report cascading with Dodeca. With that foundation in mind, today I’d like to look at elaborating on it a little bit by adding on a summary sheet with Dodeca’s built-in summary sheet functionality.
What is a Summary Sheet?
A summary sheet is a sheet in our workbook that is derived from the other sheets generated from a report cascade. For example, let’s say that in my earlier cascade example, I chose two products and two markets: Colas and Diet Colas as my products, and Washington and Oregon as my markets. This would result in four sheets/tabs being generated. Now, what Dodeca allows me to do pretty easily is turn on a summary sheet, which will automatically generate a tab for me (this will be a fifth tab in this example), and contain formulas I designate that will sum up the sheets generated from the cascade.
This is really useful for a couple of reasons. Now, in a perfect world, you’d be able to get summary data from the outline itself, for example, a parent rollup in the Product, Market, and Time dimensions. That’s the whole point of Essbase, right? But sometimes we need arbitrary groupings of things. Frequently this is accomplished with alternate hierarchies. But what if we want the user to be able to create a report with a summary value that is neither in the primary hierarchy nor any alternate hierarchies?
One way we can provide this functionality to our users is to turn on a summary sheet. Here’s a look at the summary sheet options, they are located under the Cascade option group on our Essbase Excel view:
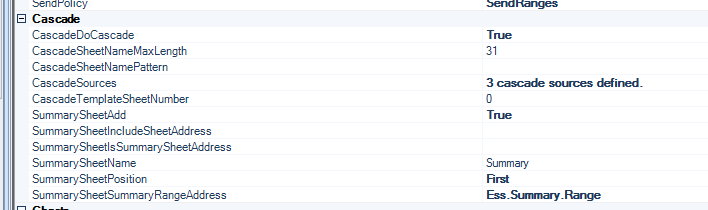
In particular, note that SummarySheetAdd is set to True. Additionally, I have specified a name for the sheet (SummarySheetName = Summary), specified a SummarySheetPosition (I can have my sheet be the first or the last sheet), and a range of cells to summarize (SummarySheetSummaryRangeAddress). Per best practices, I have created a defined name in my workbook so that I can refer to it easily. Additionally, if I adjust the rows and columns in my template, I don’t need to come back to these options and worry about updating some arbitrary range name.
Let’s go take a look at the simple source template:
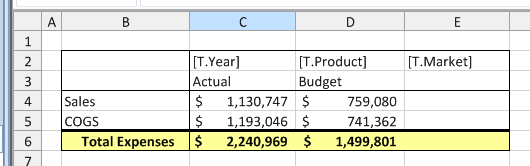
As you can see in the template, I have defined a fairly bread and butter Dodeca Excel template, where I have tokenized the Year, Product, and Market, meaning that users will be able to make choices from the selectors and build the report with whatever data they want.
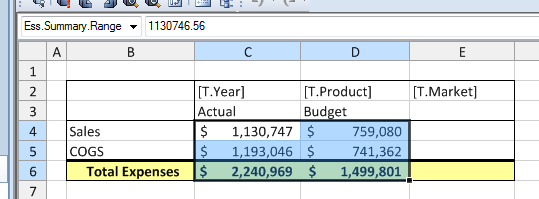
Remember the summary range I mentioned earlier? Here it is, highlighted, showing the cell ranges that will be added up on the summary tab:
Just for completeness, check out the retrieval range that will be refreshed when the view is built:
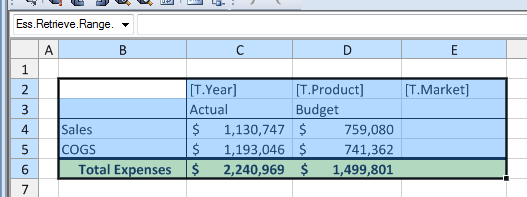
Remember, Dodeca can do multiple retrievals in a single sheet and from multiple, disparate data sources. In this case we just have a simple retrieve from the classic Sample/Basic app, but this could just as easily be relational data from SQL Server, Oracle, or all of the above.
Lastly, having made selections from multiple dimensions, let’s build the view and check out our new summary sheet. Note the Summary tab that appears first, just as we wanted:
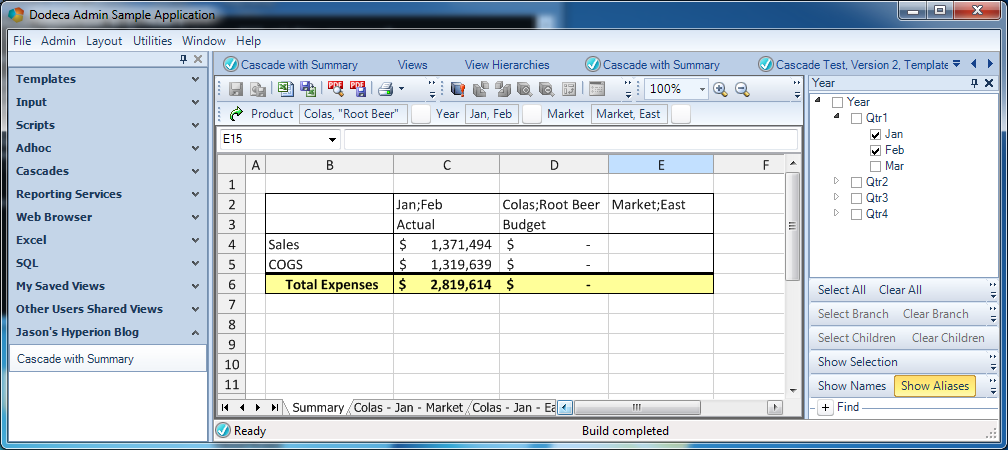
There we have it: with just a few additional options to configure, I have a nice, dynamic summary sheet in this book that users can easily use. What’s even more interesting, is that I gave a user the ability to dynamically sum up data that doesn’t have a member or alternate hierarchy to do the math for me. In this case, it’s the arbitrary sum of Colas and Root Beer for January and February.
Saving Everyone Time
Not to belabor the point, but I think this example shows off some really interesting ways that we provided flexibility to the user and saved the user and administrator time. Without such dynamic summing capabilities, our user might have resorted to pulling data down to Excel and summing things up by hand/formulas, or otherwise going out of their way to get to data that wasn’t directly in the cube. As a one off it’s not so bad, but if it’s a way of common way of seeing the data, then you are potentially saving yourself a minute here and a minute there on a repeated basis.
Our administrator saved time because this might represent an alternate member/group that would be nice to have in the outline but not necessary to have. And in today’s complex metadata management world, that might just represent time not spent marshaling a member request through a byzantine approval process.
In Summary (Pun Intended)
Summary sheets are a very easy to utilize feature in the Dodeca Spreadsheet Management System and can offer your users a convenient way of looking at data that might otherwise be inconvenient (or worse, error prone!) to look at. As with so many other Dodeca features, they can quickly add value to an existing solution and provide your users with that little bit of extra utility that takes your overall solution from good to great.