ODI journal table performance tweak with an index

The other day I provided a crash course on simple journalization in ODI with an Oracle database. I wanted to set the stage for this performance tweak that I put in awhile ago on a few tables.

I mentioned that ODI stores journalized rows in a special table it creates that tracks the subscriber, processing status, and date of each row. The possible performance issue has to do with what ODI does during the processing of rows out of the table. If you have two different systems (subscribers) for a given table, when an interface runs, it is going to process data for just one subscriber at a time (usually). During processing ODI needs to mark these rows that it’s working with by changing the JRN_CONSUMED column to 1 for each matching subscriber.

In other words, if our interface processing data out of the CUSTOMERS table (by way of the journal table J$CUSTOMERS) is for subscriber ‘MARKETING’, then at some point in the ODI interface there will be a step like this:

UPDATE J$CUSTOMERS SET JRN_CONSUMED = '1' WHERE JRN_SUBSCRIBER = 'MARKETING'

If there are a lot of rows in the table, and particularly if there are a lot of rows in this table AND there are multiple subscribers, then the WHERE clause on this UPDATE statement can be a bottleneck. This is because the JRN_SUBSCRIBER field is not indexed, meaning that Oracle has to do a full table scan to find every row with a matching value. On a few interfaces I had at a client, this step was taking an inordinate amount of time. So I added an index on the JRN_SUBSCRIBER column (and eventually added one for the combination of JRN_SUBSCRIBER and JRN_CONSUMED), and performance increased dramatically, as Oracle was now able to avoid a full table scan.

The first time I made this change was over a year ago and I haven’t seen any adverse affects or otherwise had any problems, and it dropped processing time for this one step from over 30 minutes to well under a minute.

If you have large, multi-subscriber journal tables being worked on by performance-critical interfaces, you might want to open up Operator and see how long they are taking and if a carefully placed index could benefit them.


ODI journalization crash course

I do seem to love me some ODI journalization. It has been a really great feature that I have implemented countless times to great effect. For those not familiar, journalization in ODI is where you tell ODI that you want to record what rows get updated and inserted in a particular table, such that when you load data out of that table, you can choose to work with just those updated rows.

This is useful for many obvious reasons: only processing data that’s new or changed is usually faster than processing a whole table. When you are dealing with millions and billions of rows, it’s a necessity. Journalization is also nice for instances where it replaces processing data based on time.

For example, I have reworked many systems where the data to be processed was sysdate - 1 or some other time period, and the automation runs daily. This can work. But what if something goes wrong and you don’t catch it for a day? Well, you go in and tweak things and run a one-off job to fix it. Or you have other coping mechanisms. What if data from a month ago is updated? Many times just processing anything that changed is the effective strategy.

It’s how journalization works under the hood, though, that is the focus of this post (for performance reasons). When you journalize a table (at least for the simple Oracle implementation), ODI installs a trigger on that table so that updates and inserts are recorded somewhere.

In this case, that somewhere is your work schema. If you were to journalize a table called CUSTOMERS and the primary key of customers was CUSTOMER_ID, then you would end up with a journal table called J$CUSTOMERS that has the following columns:

  • JRN_SUBSCRIBER
  • JRN_CONSUMED
  • JRN_FLAG
  • JRN_DATE
  • CUSTOMER_ID

The structure will always be the four JRN_ columns and the primary key (which can be multiple columns but is often just one) of the table being recorded. This simple table records everything you need to know about the new and updated rows.

Here’s a quick crash course in these columns:

JRN_SUBSCRIBER: You supply a text name indicating what the consumer of the data will be. For example, you may have two systems that independently want to process new and updated customers, so you might have two subscribers: MARKETING and CRM, for example. Rather than creating two separate journal tables, we just have a column in here to differentiate the columns.

JRN_CONSUMED: This defaults to 0 and will be 0 until processing data out of the journal occurs. This column provides a really elegant solution to making sure you don’t lose data when processing journalized data. When an ODI interface runs to process data out of a journal, it sets the JRN_CONSUMED column for rows to process to 1. This does a couple of things. One, any rows that are added to the journal after a job starts do not get lost or otherwise suffer from some timing issue. They will just get picked up on the next processing job. Two, if the ODI interface fails for some reason, before it completes successfully, and you need to re-run the job, you won’t have lost the journalized rows: they are only dropped when the job successfully completes (it’s one of the last cleanup steps in the job).

JRN_FLAG: Indicates whether the row was inserted or updated (I or U), although in practice you will notice that the value is always ‘I’, indicating an inserted row (even if it was actually just an update). This is because later on in the job ODI will mark rows that are actually updates with a U and then handle the processing accordingly

JRN_DATE: The date (time) that the row was recorded into the journal.

With all of this infrastructure in place (plus a couple of views that ODI puts in for you), journalization is ready to go. You design your interface as normal, and if you want to process just the new/updated rows, all you have to do is check a single checkbox on the Mapping tab (Use Journalized Data). ODI handles the rest for you.

This is a really killer feature of ODI and can cleanup countless home-brew solutions that are fragile, complex, and code-intensive.

That being said, the original purpose of this post was to actually talk about a performance issue with ODI journals, but it was necessary to provide some context with an overview of journalization first. With that out of the way, check back tomorrow for a tweak you can make to your journal tables that might speed things up if you are processing large amounts of data!

ODI Oracle Merge Incremental Update burns sequence values

I use Oracle Data Integrator for quite a bit of ETL work. Most of it tends to be with Oracle databases, but also a fair bit with MySQL, SQL Server, and others. A common integration is to update data in a table based on a primary key, and insert new data if existing data doesn’t exist.

It’s also common to insert a sequence value into a row that you populate in a table somewhere. Sequences in Oracle are this mechanism where you basically ask them “Hey, give me the number in something we’re counting!” and then plug that value in. They are commonly used to generate unique values for rows that get inserted somewhere.

Sequences aren’t random numbers – they start off at 1 (or whatever you configure them to) and then count up, and up, and up. Like up to the number 999999999999999999999999999 (that’s huge!). In fact, there’s so many possible sequence values that if you happen to use a few by mistake, it’s not that big of deal. Just use a new sequence value! It’s not uncommon to see gaps in a table or rows that have a sequence value – this just happens due to the way data is processed and how the Oracle server will return blocks of sequences to be used in a given operation, then discard any that don’t get used (this might seem wasteful, but it’s not).

In any case, I was alerted to something interesting in a client’s ETL job awhile ago: sequence values in a table being updated by ODI were starting to seem abnormally large. In other words, this table generally has about 100,000 rows in it, and they are used to the sequence values being less than a hundred million or so. All of a sudden the sequence values were trending much higher.

It turns out that the job in question uses the MERGE Oracle IKM to update rows. This is a strategy where existing rows (identified by a particular primary key) are updated based on the primary key, and new rows are inserted. MERGE is kind of an elegant way of writing this without having to have separate UPDATE and INSERT step. In fact, MERGE is thought of as an “upsert” due to being a combination of the two.

Under the hood, it seems that Oracle rewrites MERGE queries into something resembling two separate steps. And the way that Oracle rewrites the query is such that it burns or otherwise needs to use a sequence value for every row in the table, on every run. So if there are 100,000 rows in the table, about 100,000 sequences are getting used on each run, even if only one row is being updated. Couple this with the fact that the job runs hourly and almost always processes data, and you have a recipe for sequence values to go up pretty fast.

Of course, we could literally burn one trillion sequence values on every run of the job, and schedule the job to run a trillion times a day, and still not have to worry about running out of sequence values. But it does seem kind of wasteful.

For this reason, you might want to use one of the other Oracle Incremental Update IKMs, such as the traditional INSERT/UPDATE.

Late note: I wrote all this up and it seems that the IKM was modified to strip out a clause from the MERGE statement that would prevent rows that already existed in the target from even being touched, thus reducing the amount of rows in the MERGE data set, and thus lowering the rate at which sequence values would get burned. So I think the stock MERGE IKM is still fine to use with sequences in the target. It’s still true that MERGE will use sequence values on non-updated rows, it’s just that ODI tries to be smart and reduce the update recordset to not include those in the first place.

Glitch with a non-printing Unicode character in member name

This is an Essbase bug, kind of. I’ve been working on a project lately that uses the relatively new MaxL Essbase outline export command (yes, Pete, I called it relatively new again, even though according to you it’s not… well, it’s relatively NEW TO ME SO THAT’S WHAT MATTERS… :-). Anyway, I wrote a quick XML parser for the output, using Java.

The nice thing about the parser is that it uses something in the Java language called JAXB. It’s a really nice way of modeling the contents of an XML file using Java classes, so that you don’t have to write your own parsing code, which is tedious and error prone. There are reasons you might use either approach, but overall I have been very happy over the last few years with the ability to write XML readers in Java with JAXB.

Curiously, I came across an outline export that would cause the parser to throw an exception. The Java stack trace indicated that an illegal character (0x1f – that’s not the character itself, rather, the Unicode character ID) was at fault. Specifically, character 0x1f is the “unit separator” character. In a nutshell you might say that while most of us are used to writing things with letters and numbers and things like tabs, spaces, and newlines, there happen to be all of these other weird characters that exist that have arcane uses or historical reasons for existing. It’s such a prevalent issue (or at least, can be) that many advanced text editors have various commands to “show invisibles” or non-printing characters. One such tool that many of us Essbase boffins are adept with is Notepad++ – a veritable Swiss army knife of a text editor.

Nicely enough, the Java stack trace indicated that the problem in the XML was with parsing a “name” attribute on a <Member> tag – in other words, an Essbase member name in the source outline contained an invisible character. As it turns out, in XML 1.0 it is illegal to have this particular character. So while Essbase happily generates invalid XML during the export, when I try to import it with Java, I get the exception. But how to find the offending member? I mean, how do you do a text search for an invisible character (seriously, this is like some “what is the sound of one hand clapping” kind of stuff).

In Notepad++ you can search for a regular expression. So I turned on Show Invisibles, pulled up the Find dialog, checked on the “Use Regular Expressions” option, then typed in [\x1f] which is is the Regex code to tell Notepad++ to search for this little bastard of a character. Sure enough, there was exactly one in the output file that surely snuck in from an otherwise innocuous copy and paste to EAS some time ago. I fixed the member name in EAS, reran the export, reprocessed with the parser, and all was well again in the universe.

Drillbridge White Paper now available

I’m crossing another bucket list to-do item off of my list: writing my first white paper. And what’s it on? Drillbridge, of course. I’ll be making it available to a wider audience next week, but if anyone is interested in a concise, succinct paper on how Drillbridge works, and how it can be used to quickly implement drill-through with a minimum of resources, please email me and I’ll send it right over. I’d love to get your thoughts.

cubus outperform EV Analytics Review: Position in the Enterprise

Welcome to the fourth installment of my increasingly inaccurate EV three-part review. If you missed the first three parts, you can check out the EV backgroundusing EV, and using EV continued parts to catch up!

I hope you enjoyed this little mini-series on a really interesting tool so far. As I mentioned in the first article, this tool has a special place in my heart owing to how critical it was to my Essbase life going back as far as 2005. I was quite the EV enthusiast back in the day within my company, but when I talked to people about trying it out or using it, it quite often fell flat. I’d often hear, “Why don’t I use the Excel add-in?” or “Why do I need another tool for that, I already have [whatever]” or “isn’t the enterprise standard [some enterprisey thing]?”

I see where these people were coming from. I get it. In a world where the tools that users are given are often prescribed quite strictly for them, having one more tool to support is matter to be taken lightly: licensing costs, support, training, and all the normal fun IT things.

For these reasons, I prefer to think of EV as another tool in the toolbox for my users – not the exclusive tool. It’s not the end-all-be-all enterprise reporting solution like Financial Reporting, and it’s also a distinct experience apart from Smart View. Consider these tools:

  • Smart View
  • Planning
  • Financial Reporting
  • Tableau
  • Dodeca
  • cubus EV

Then consider the following evaluation criteria:

  • Ease of use / Learning curve
  • Report definition handled by user or admin?
  • Installation
  • Data visualization ability
  • Primary usage reason
  • Relation to other tools

I won’t exhaustively put these all on a spectrum for each property (I’ll save that for a future post), but looking at a few of these products and these evaluation criteria, I can point out a few things.

Smart View, Tableau, and EV are all ostensibly self-serve: you just make them available to the user, they point it at a data source, and then perform analysis and reporting, much to their bean counting merriment. Planning, Dodeca, and Financial Reporting ostensibly require some administrator to have put in some structure ahead of time that the user will consume.

As for ease of use, EV certainly isn’t harder to use than Smart View, if anything it’s a bit simpler. EV makes it hard if not impossible to put your grid into an inconsistent state with respect to the underlying OLAP data source, meaning that you can’t really screw things up by moving some member to the wrong column. Easier to use than EV, however, would be Dodeca and FR. Planning gets kind of its own special place on this spectrum (it’s not easy per se, it’s not hard… it’s something). Similarly for Tableau – a bit of a learning curve, simple reports are fairly straightforward, but the sky is the limit for some of the crazy visualizations you can do.

Speaking of data visualization, Tableau is quite clearly the champ out of all of these. Dodeca and Smart View have similar support for charting (by way of Excel or Excel-like charts). EV’s isn’t ostensibly a data visualization environment, but it’s visualization capabilities in terms of bread and butter charting are compelling, particularly the way that it is an absolutely seamless experience with respect to the data grid you’re working with. In other words, with Excel/Smart View you add in a chart if you want, in EV the data IS the chart if you want it to be. Or it’s just the data – or it’s both at the same time.

Installation for EV is pretty straightforward and a little better than Smart View since there isn’t an installer to worry about, so it’s nice being able to just give your use a URL and away they go. Similar props for Dodeca and most of the other tools on this list.

Final Thoughts

So what does this all add up to? I think that EV is a great tool to have IN the toolbox, but not the ONLY tool in the toolbox. Almost paradoxically it is a compelling tool for your advanced Smart View users but also for Smart View novices that may be intimidated by ad hoc queries and multi-dimensional concepts. EV rewards the user of a well-constructed cube, with a competent and functional UI that extends the value of properly deployed features, such as Dynamic Time Series, UDAs, attribute dimensions, sensible member names, and more.

On the other hand, it doesn’t seem to be for everyone: based on my own prior experience, it can be a confusing addition to the technological landscape for some IT managers (not to mention one more mouth to feed, system-wise), and might run into “But we already have X for that” syndrome. Again, I think it’s a complement and not a replacement or enterprise standard. There are countless scenarios I can imagine where if I were to be dropped into some enterprise as the benevolent dictator of all things BI (or OLAP, or EPM, or whatever), I would say “let’s take this thing out for a spin and see what people think” and would give Decision Systems or cubus a call.

Drillbridge Token Parameter Overview

Tokens in Drillbridge are a large part of the secret sauce that makes everything work so well. They are simple, flexible, and powerful. If you haven’t noticed, they are essentially JSON strings that have a range of allowable values. The most common of these are “name” and “expression”, but there are actually a handful of other keys that are less well known but incredibly useful. I’m going to cover the current state of Drillbridge tokens in this post.

As of the current version of Drillbridge (version 1.5.2), the following parameters on tokens are recognized:

  • name
  • expression
  • drillToBottom
  • sampleValue
  • quoteMembers
  • suppressParentheses
  • overflow
  • overflowAt
  • flags

Parameter: name

The name parameter has been around since day one. It identifies which dimension the token is replacing text for. For example, if the expression for the token will be generating the names of members in the Time dimension, then the value of name would be Time. The name here should exactly match the dimension, even including spaces. For example, if the dimension is named “Time Periods” then the value for this token should be “Time Periods” and NOT “Time_Periods”. This is a common issue that pops up (I’m guilty of it myself).

Parameter: expression

The expression parameter is where most of the magic happens. A lot has been written about expressions in Drillbridge on the Drillbridge Wiki so I will save some examples of expressions for a future article.

Parameter: drillToBottom

Possible values for this parameter are either “true” or “false” and nothing else. The default for this token value is false, so if you aren’t drilling to the bottom then you don’t even need to include this. This option is used to indicate that the incoming member should have its level-0 descendants pulled from the outline, then have transformation in the expression applied to them. For example, if you drill on Qtr1, the values that get processed by Drillbridge from the outline are Jan, Feb, and Mar, and if you have the #monthToDigit function as part of your expression, these will be converted to 1, 2, and 3. Note that when using this setting, you almost always need to have an associated Essbase cube on your report (so it knows which cube outline to search).

Parameter: sampleValue

Used purely to help testing. Putting a value here will simply pre-populate the text box on the report test screen so that you don’t have to keep putting values in by hand. It is really, really, handy.

Parameter: quoteMembers

By default, this is set to true. On queries where multiple values are pulled from the outline, you will typically use an IN SQL clause. For example, the generated SQL might be something like “WHERE Time IN (‘1’, ‘2’, ‘3’)”. This happens if Drillbridge generated the values of 1, 2, and 3. As you can see, each of these values has a single quote before and after it – Drillbridge put that in automatically. There are some cases where you won’t want Drillbridge to automatically put quotes in, such as advanced queries where you need to define the structure a little differently (such as for performance reasons). Possible values for this parameter are true or false. If false then the generated code in this example would be like this: “WHERE Time IN (1, 2, 3)”.

Parameter: suppressParentheses

Similar to the previous example, when Drillbridge generates a list of members, it will automatically enclose it within parentheses. For example, the parentheses surrounding 1/2/3 here: “WHERE Time IN (‘1’, ‘2’, ‘3’)”. Most SQL dialects seem to enclose their lists with parentheses, but for ones that don’t or where you need more control over the generated code, you can set suppressParentheses to true, and Drillbridge will not add in the parentheses for you. If you need to get creative with how you write your query (again, probably for performance reasons) then you might find yourself using this parameter.

Parameter: overflow

The overflow parameter is a relatively new addition. Some SQL languages and versions have a limit to the number of things you can put in the IN clause. For many versions of Oracle, this is 1,000. The normal way of programming around this (and what most versions of Drillbridge do) is just clip anything over 1,000, so that your query won’t fail. But what if you just absolutely need those 1,500 things or 10,000 or whatever it is? Modern Drillbridge versions have your back. The overflow parameter let’s you specify an additional template to append to the query, then replace it with additional members from the list of generated members.

Here’s an example: let’s say that there are an arbitrary number of accounts in the Account dimension, named Account 0000001 through Account 1000000. Let’s also say that drillToBottom is set to true and that the member that the user drills on would result in some 5,000 members being queried. Again, the normal behavior to handle this would be to clip the member list to 1,000 or whatever the default setting is (it can be configured in Drillbridge to whatever you want), then fire off the query. So the relevant portion of the query would look something like this:

WHERE Account IN ('Account 0000001', 'Account 0000002', ... , 'Account 0001000')

Using the overflow parameter, you could specify an overflow value of the following:

overflow: " OR Account IN %%OVERFLOW%%"

What Drillbridge will do is use the first 1,000 entries as it normally would, then cycle through the rest, generating subsequent lists that are placed into the %%OVERFLOW%% text inside the overflow token, then the whole thing is appended to the whole token replacement. This let’s us sidestep the natural 1,000 or whatever item limit on many RDBMS.

Parameter: overflowAt

This token expects a numerical value and it just specifies how big the groups should be that members are broken up into for the overflow parameter. The default is 1,000 but depending on your needs you may wish to set it lower or higher.

Parameters: flags

Flags is meant to be a sort of catchall bucket for various configuration settings that might be specific to the underlying technology without having to create official parameters. It is a comma-delimited list of flags. The only recognized flag at the moment is “~”, such that your flags parameter would look like this:

"flags": "~"

This is a special flag that comes into play on a Essbase Member Resolver. For tokens using drillToBottom, this tells the Essbase routine that fetch the descendants of the drilled member to ignore any members that have a consolidation operator of ~.
Thoughts on deprecated Essbase 11.1.2.4 features and the future of EAS

The Hyperion blogging-verse has been quite aflutter with the release of 11.1.2.4. So I won’t bore you with a recap on new features, since that has been done quite effectively by my esteemed colleagues. I will say, however, that by all accounts it seems to be a great release.

Oracle is really starting to hit their stride with EPM releases.

As a brief aside: I seem to be in the relative minority of EPM developers in that I come from the computer science side of things (as opposed to Finance), so believe me when I say there is a tremendous amount of energy and time spent to develop great software: writing code, testing, documenting, and more. Software is kind of this odd beast that gets more and more complex the more you add on to it.

Sometimes the best thing a developer can do is delete code and remove features, rather than add things on. This is a very natural thing to happen in software development. Removing features can result in cleaner sections of code that are faster and easier to reason about. It typically sets the stage for developing something better down the road.

In the software world there is this notion of “deprecating” features. This generally means the developer is saying “Hey, we’re leaving this feature in – for now – but we discourage you from building anything that relies on it, we don’t really support it, and there’s a good chance that we are going to remove it completely in a future release.”

With that in mind, it was with a curious eye that I read the Essbase 11.1.2.4 release notes the other day – not so much with regard to what was added, but to what was taken away (deprecated). EIS is still dead (no surprise), the Visual Basic API is a dead end (again, not a secret), some essbase.cfg settings are dead, direct I/O (I have yet to hear a success story with direct I/O…), zlib block compression is gone (I’m oddly sad about this), but interesting for now is this little tidbit: the Essbase Administration Services Java API is deprecated.

For those of you who aren’t aware, there is a normal Java API for Essbase that you may have heard of, but lurking off in the corner has been a Java API for EAS. This was a smallish API that one could use to create custom modules for EAS. It let you hook into the EAS GUI and add your own menu items and things. I played with it a little bit years ago and wrote a couple of small things for it, but nothing too fancy. As far as I know, the EAS Java API never really got used for anything major that wasn’t written by Oracle.

So, why deprecate this now? Like I said, it’s kind of Oracle’s way of saying to everyone, “Hey, don’t put resources into this, in fact, it’s going away and if you do put resources into it, and then you realize you wasted your time and money, we’re going to point to these release notes and say, hey, we told you so.”

Why is this interesting? A couple of things. One, I’m sad that I have to cross off a cool idea for a side project I had (because I’d rather not develop for something that’s being killed).

Two (and perhaps actually interesting), to me it signals that Oracle is reducing the “surface area” of EAS, as it were, so that they can more easily pivot to an EAS replacement. I’m not privy to any information from Oracle, but I see two possible roads to go down, both of which involve killing EAS:

Option 1: EAS gets reimplemented into a unified tool alongside Essbase Studio’s development environment.

Option 2: EAS functionality gets moved to the web with an ADF based front-end similar in nature to Planning’s web-based front-end.

I believe Option 2 the more likely play.

I always got the impression from the Essbase Studio development environment that it was meant to more or less absorb EAS functionality (at least, more than it actually ever did). I say this based on early screenshots I saw and my interpretation of its current functionality. Also, Essbase Studio is implemented on the same framework that Eclipse (one of the most popular Java programming environments) is, which is to say that it’s implemented on an incredibly rich, modular, flexible environment that looks good on multiple OS environments and is easy to update.

In terms of choosing a client-side/native framework to build tools on, this would be the obvious choice for Oracle to make (and again, it seems like they did make this choice some time ago, then pulled back from it).

The alternative to a rich “fat client” is to go to the web. The web is a much more capable place than it was back in the Application Manager and original EAS days. My goodness, look at the Hyperion Planning and FDMEE interfaces and all the other magic that gets written with ADF. Clearly, it’s absolutely technically possible to implement the functionality that EAS provides in a web-based paradigm. Not only is it possible, but it also fits in great with the cloud.

In other words, if you’re paying whatever per month for your PBCS subscription, and you get a web-based interface to manage everything, how much of a jump is it for you to put Essbase itself in the cloud, and also have a web interface for managing that? Not much of a leap at all.

cubus outperform EV Analytics Review: Using EV continued

Welcome to the third part of my review of cubus outperform EV Analytics. You might want to check out the first and second parts if you’re just coming in.

Last time I left off with using EV for grid oriented operations, but EV has some compelling chart features that I wanted to go over. Probably the most compelling aspect of EV’s charting functionality is that you essentially get it for free, and it is seamlessly integrated into the EV experience.

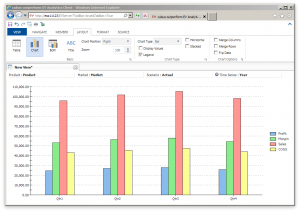
Recall that in the previous EV reviews I did, I mentioned that EV is less freeform than Excel, in a good way. By tightening the user interaction model, EV can provide a more polished user experience. This is true of charts as well. For any given grid you may be looking at, you just have to click the chart button and EV will generate a chart. Note that EV doesn’t generate an image object for you, it literally just changes your view of the data to be a chart rather than a grid.

Here’s an example:

A simple Sample/Basic view that has been changed into a chart

A simple Sample/Basic view that has been changed into a chart

The chart data is based on Sample/Basic as with before. The rows and columns have been used to generate the chart, and the POV/Page members are just “global” members as before. What’s really awesome is that you can click on the members (like Qtr1, Qtr2) and bring up the same member selection dialog as with before. Any member selection changes you make will be automatically reflected in real time, so there’s no chart to update or regenerate.

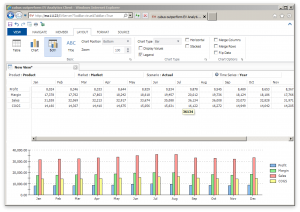
You can also choose to see both data and a chart at the same time, like this:

Chart and data shown at the same time (the 'Both' option)

Chart and data shown at the same time (the ‘Both’ option)

This is known as “Both” mode as opposed to Table or Chart which we have now seen. EV provides some rudimentary options for arranging the positions of things. In this case it’s horizontal with chart on the bottom but this can be easily configured a little differently. Other types of charts are also provided.

The charting capabilities in EV won’t give advanced visualization tools like Tableau a run for their money, but they are definitely on par with charting in Excel and in terms of the ease of use, they are much more approachable than Tableau and even Excel. I used to create decks of reports using EV and while they were generally table-based, there were a few “jawdropper” tabs where a particular bar or pie chart really hit a point home.

This article concludes my high-level overview of EV features. This has not been an exhaustive review of EV features, mind you, as EV has some other features that are interesting. These include Canvases (multiple EV views on a single page), user input (like lock and send or submitting data), dynamic selections, awesome support for attribute dimensions and dynamic time series, traffic  lighting data cells based on value, and more.

The next part and final part of this series will consider EV’s position within the enterprise and how it stacks up against other tools, including Smart View, Planning, Dodeca, and Tableau.

Drillbridge handling dimensions with spaces

Drillbridge’s powerful mapping abilities handle most common transformations with ease – stripping a prefix, converting a month into digits, or letting you use the Java language itself to parse a string however you need. Every dimension that gets drilled from is represented as a variable that a Drillbridge administrator can use to build their own expression. For example, if there is a dimension called Years in the cube, and the user drills on a member named FY15, then on the report side of things, there will be a variable referenced as #Years that will have the value of “FY15”. From here it would be typical to use the #removeStarting function to strip off the FY, and perhaps prepend the string “20”, then use that in a database query.

Something interesting happens, however, when the dimension has spaces in it. Let’s say that the dimension name is “Time Periods”. For perhaps obvious reasons, Drillbridge can’t create a variable with a space in it, because it’d look like a variable followed by a string (like #Time Periods). Instead, Drillbridge will replace spaces with underscores for purposes of creating a variable. In this case the variable would be #Time_Periods.

So #Time_Periods is the variable that is used inside the token expression, but what about the name of a token? The name of a token should still be the name of the dimension, using spaces, not underscores.

Consider the following tokenized query:

SELECT *
FROM Transactions
WHERE MONTH(PostDate) IN {{
"name" : "Time Periods",
"expression": "#monthAbbreviationToDigit(#Time_Periods)",
"drillToBottom": "true", "quoteMembers": "false"
}}

As you can see, the name parameter has the space, but the expression uses the underscored version of the variable name. In this case we’re also using the very handy #monthAbbreviationToDigit built-in function that can convert month names like Jan, Feb, and so on to 1, 2, or the proper month number.