I freely submit that I am a complete geek. But it’s okay, because I have come to accept and embrace that inner geek. Anyway… Many organizations run jobs to perform a task as certain intervals. Your job as a good Essbase/Hyperion administrator is to be lazy — that is, make the computers do the boring stuff, while you get to do the fun stuff, like thinking. What we end up doing is setting up batch and script files that do all of the things in a particular sequence that we might do by hand. So instead of logging in, copying a data file, clearing a cube, running a calc, loading some data, running another calc, and all that other stuff, we do this automatically.
After a while, you get a feel for how long a certain job takes. The job that loads last week’s sales might take about an hour to run. The job to completely restate the database for the entire fiscal year might take six hours to run. This probably also becomes painfully obvious when it turns out that the job didn’t run correctly, and now you need to run it again (and keep those users happy). I am all about jobs running as fast as they can. This is useful on a few different levels. First and probably foremost, it finishes faster, which is nice, especially for those times when the sooner you have data the better. It’s also nice when you need to re-run things. It can also open up some new possibilities to use the tool in ways you didn’t think or know you could — such as during the business week, getting live updates of data.
Typically there are a few big time-killers in an automated process. These are the data loads, calculations, and reports that are run. There are also some others, such as calling out to a SQL server to do some stuff, restructuring outlines, pulling tons of data off the WAN, and all that. You can always go through your database logs to see how long a particular calculation took, but this is a bit tedious. Besides, if you’re like me, then you want to look under EVERY single nook and cranny for places to save a little time. To borrow an a saying from the race car world, instead of finding one place to shave off 100 pounds, we can find 100 places to shave off one pound. In practice, of course, some of these places you can’t cut anything from, but some of them you can cut down quite a bit.
The first, and probably most important step to take is to simply understand where you are spending your processing time. This will give you a better window into where you spend time, rather than just a few things in the normal Essbase logs. There are numerous ways you can do this. But, if you know me at all by now, you know that I like to do things on the cheap, and make them dead-simple. That being said, the following posts will be based around Windows batch file automation, but the concepts are easily portable to any other platform.
First of all, take a look at the below graph:
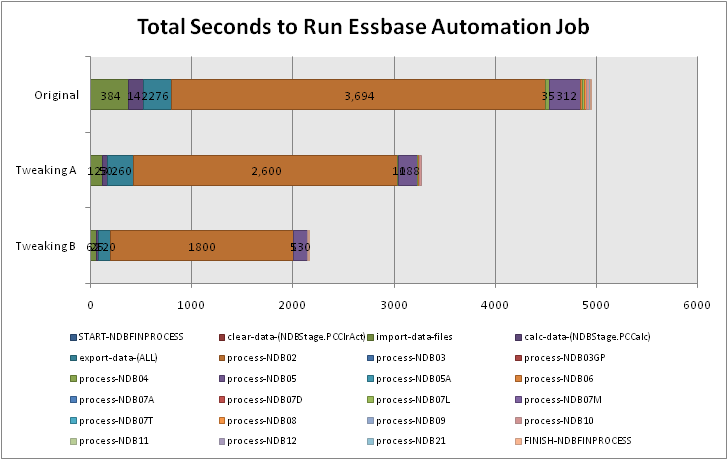
Total Seconds to Run Essbase Automation Job
What you’re looking at is a graph that has been created in Excel, based on data in a text file that was generated as a result of a profiling process. The steps are as granular as we want them to be. In other words, if we simply want to clump together a bunch of jobs that all run really fast, then we can do that. Similarly, if we want to break down a single job that seems to take a relatively long amount of time, we can do that too. Each segment in the starcked bar chart is based on the number of seconds that the particular step took. We can see that in the original (pre-optimization) scenario, the orangey-brown step takes up a pretty considerable amount of the overall processing time. After some tweaking, we were able to dramatically slash the amount of time that it took to run the whole job. And, in the third bar, after yet more tweaking, we were able to slash the overall processing time quite a bit again.
The important thing here is that we are now starting to build an understanding of exactly where we are spending our time — and we can therefore prioritize where we want to attempt to reduce that time. My next post will detail a sample mechanism for getting this kind of raw data into a file, and the next few posts after those will start to dig in to where and how time was shaved off due to better outline, system, and other settings and changes. Happy profiling!