It’s very common to want to perform reporting with a rolling time period. For example, given a particular month chosen by the user, we’d like to display the 4 or 12 or however many previous months to it. We might be given a particular quarter and want to show the previous 4 quarters.
Achieving such dynamic reporting can be tricky in some tools or lead to a less than ideal user experience, but this type of layout can be achieved easily in Dodeca, without having to write any code (although we will use some Excel formulas).
The technique itself is pretty simple, as I will describe in a moment. But I also want to comment on the general technique, since it applies to so many different Dodeca reports. The way that we can easily build this report type has to do with the nature of using a spreadsheet as the basis of the report in the first place.
In Dodeca, we have extreme control over a very methodical report build sequence. The simplest Essbase retrieve we could lay out would be a normal Essbase retrieval grid (members from each dimension, laid out properly). We can then elaborate on this and tokenize various cells in the retrieval grid so that the user selection is placed in for certain cells (such as the time period), and then the grid is retrieved. If we want, we can dynamically build the contents of the grid (such as running an MDX script to retrieve dimension properties). More specific to this case, however, is that we can use use Excel formulas in the cells that participate in the retrieve.
As a simple example, consider a report where the user chooses a year such as FY16. If we want the report to always show the year the user chose, plus the previous year, then we could just write a formula for the column next it, such as ="FY" & RIGHT(A1, 2) + 1. At runtime, Dodeca drops the value from the selector in, and in the case of FY16, our formula will evaluate to FY17, then Dodeca performs the retrieve. Using an elaboration on this technique, we can easily calculate the rolling quarters to show on a report.
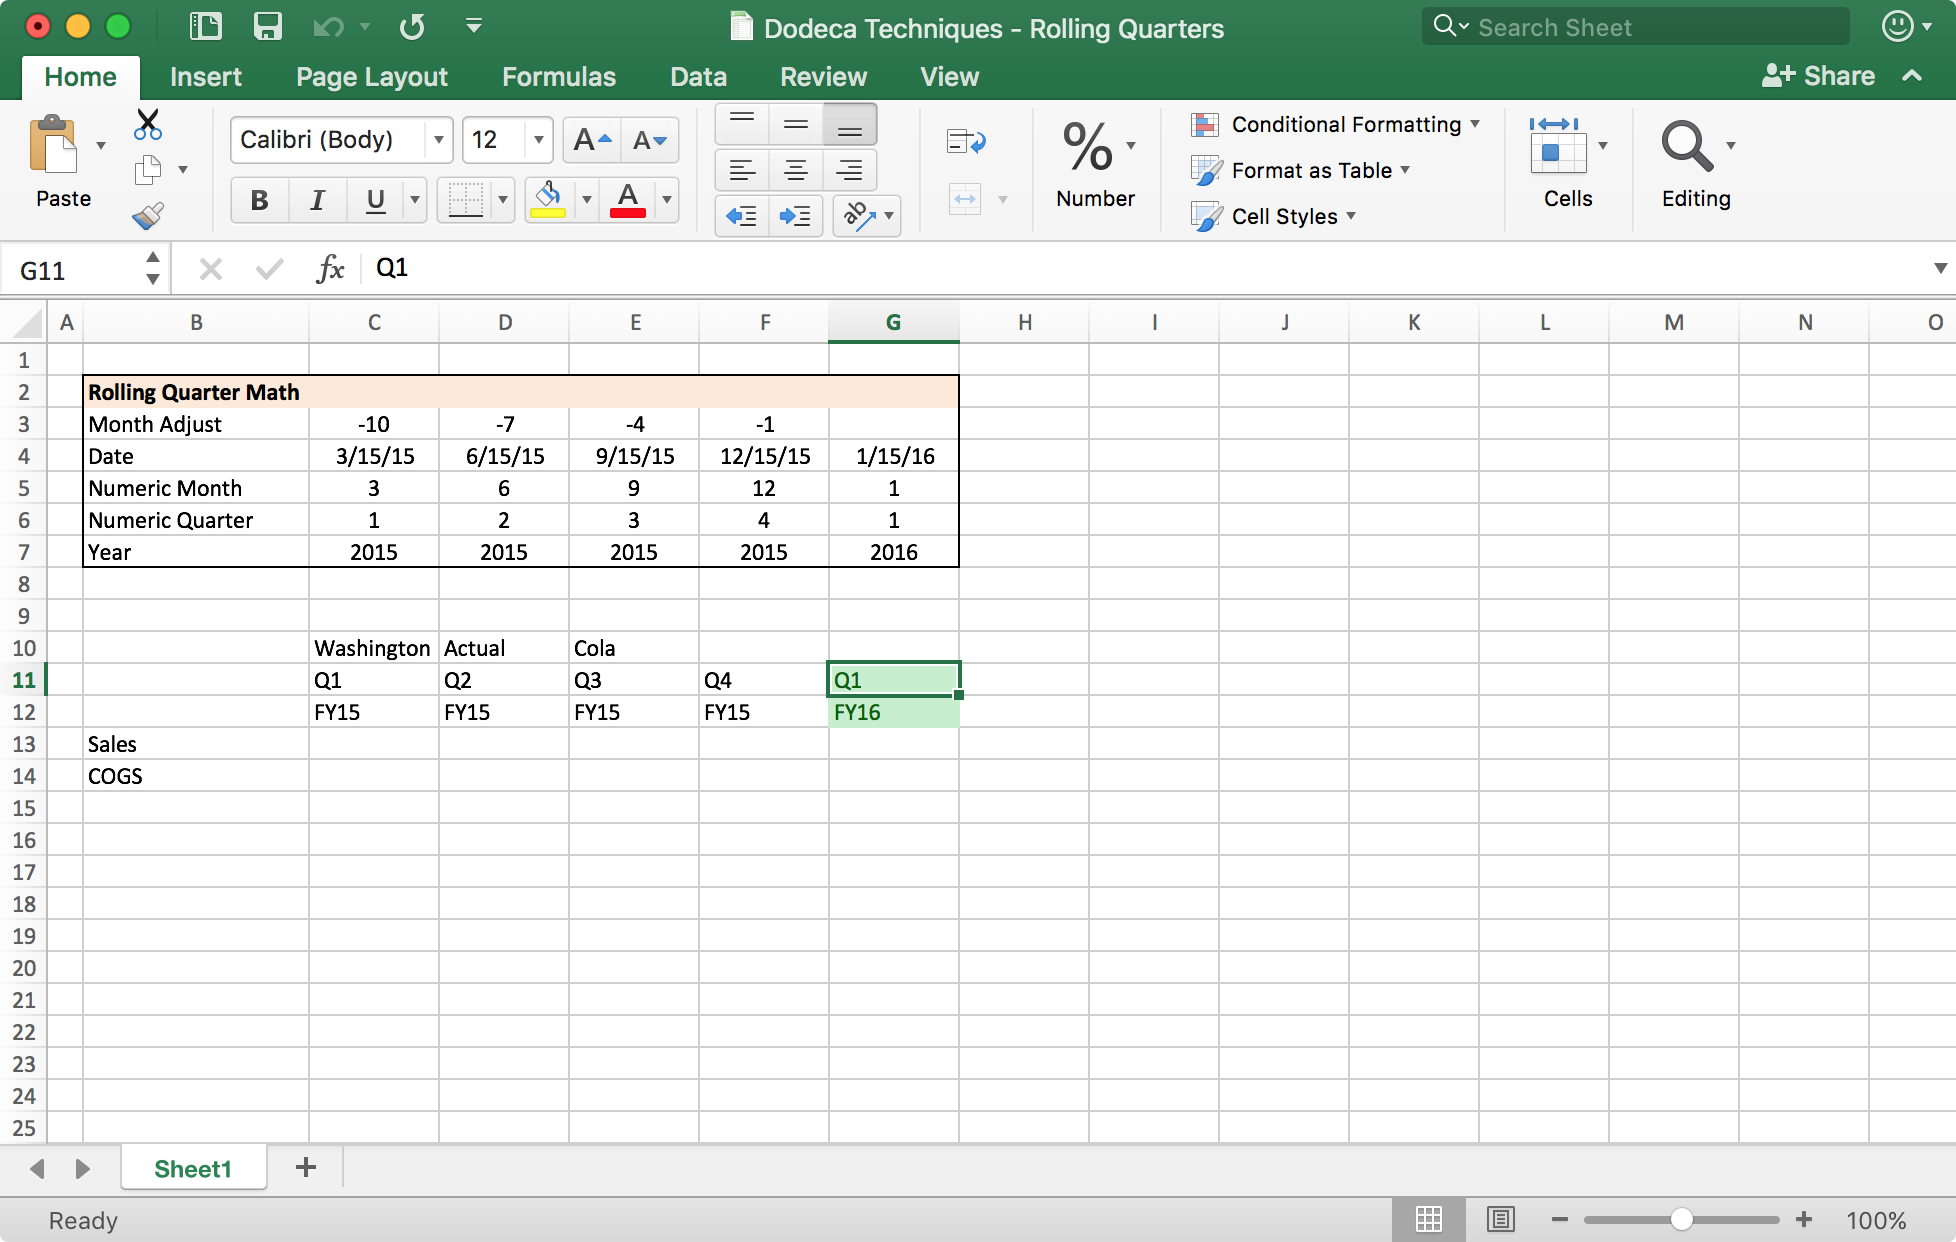
Check out this report template:
A simple Dodeca template that calculates rolling quarters
In this report, I will have two selectors that will fill in the green cells. The user will choose a quarter and a year. The four columns to the left of the green cells are calculated dynamically. The upper area in this sheet is my “work area” that will actually just be hidden when the report is built. For a real world report I would probably have condensed the formulas down a bit, but it won’t affect performance.
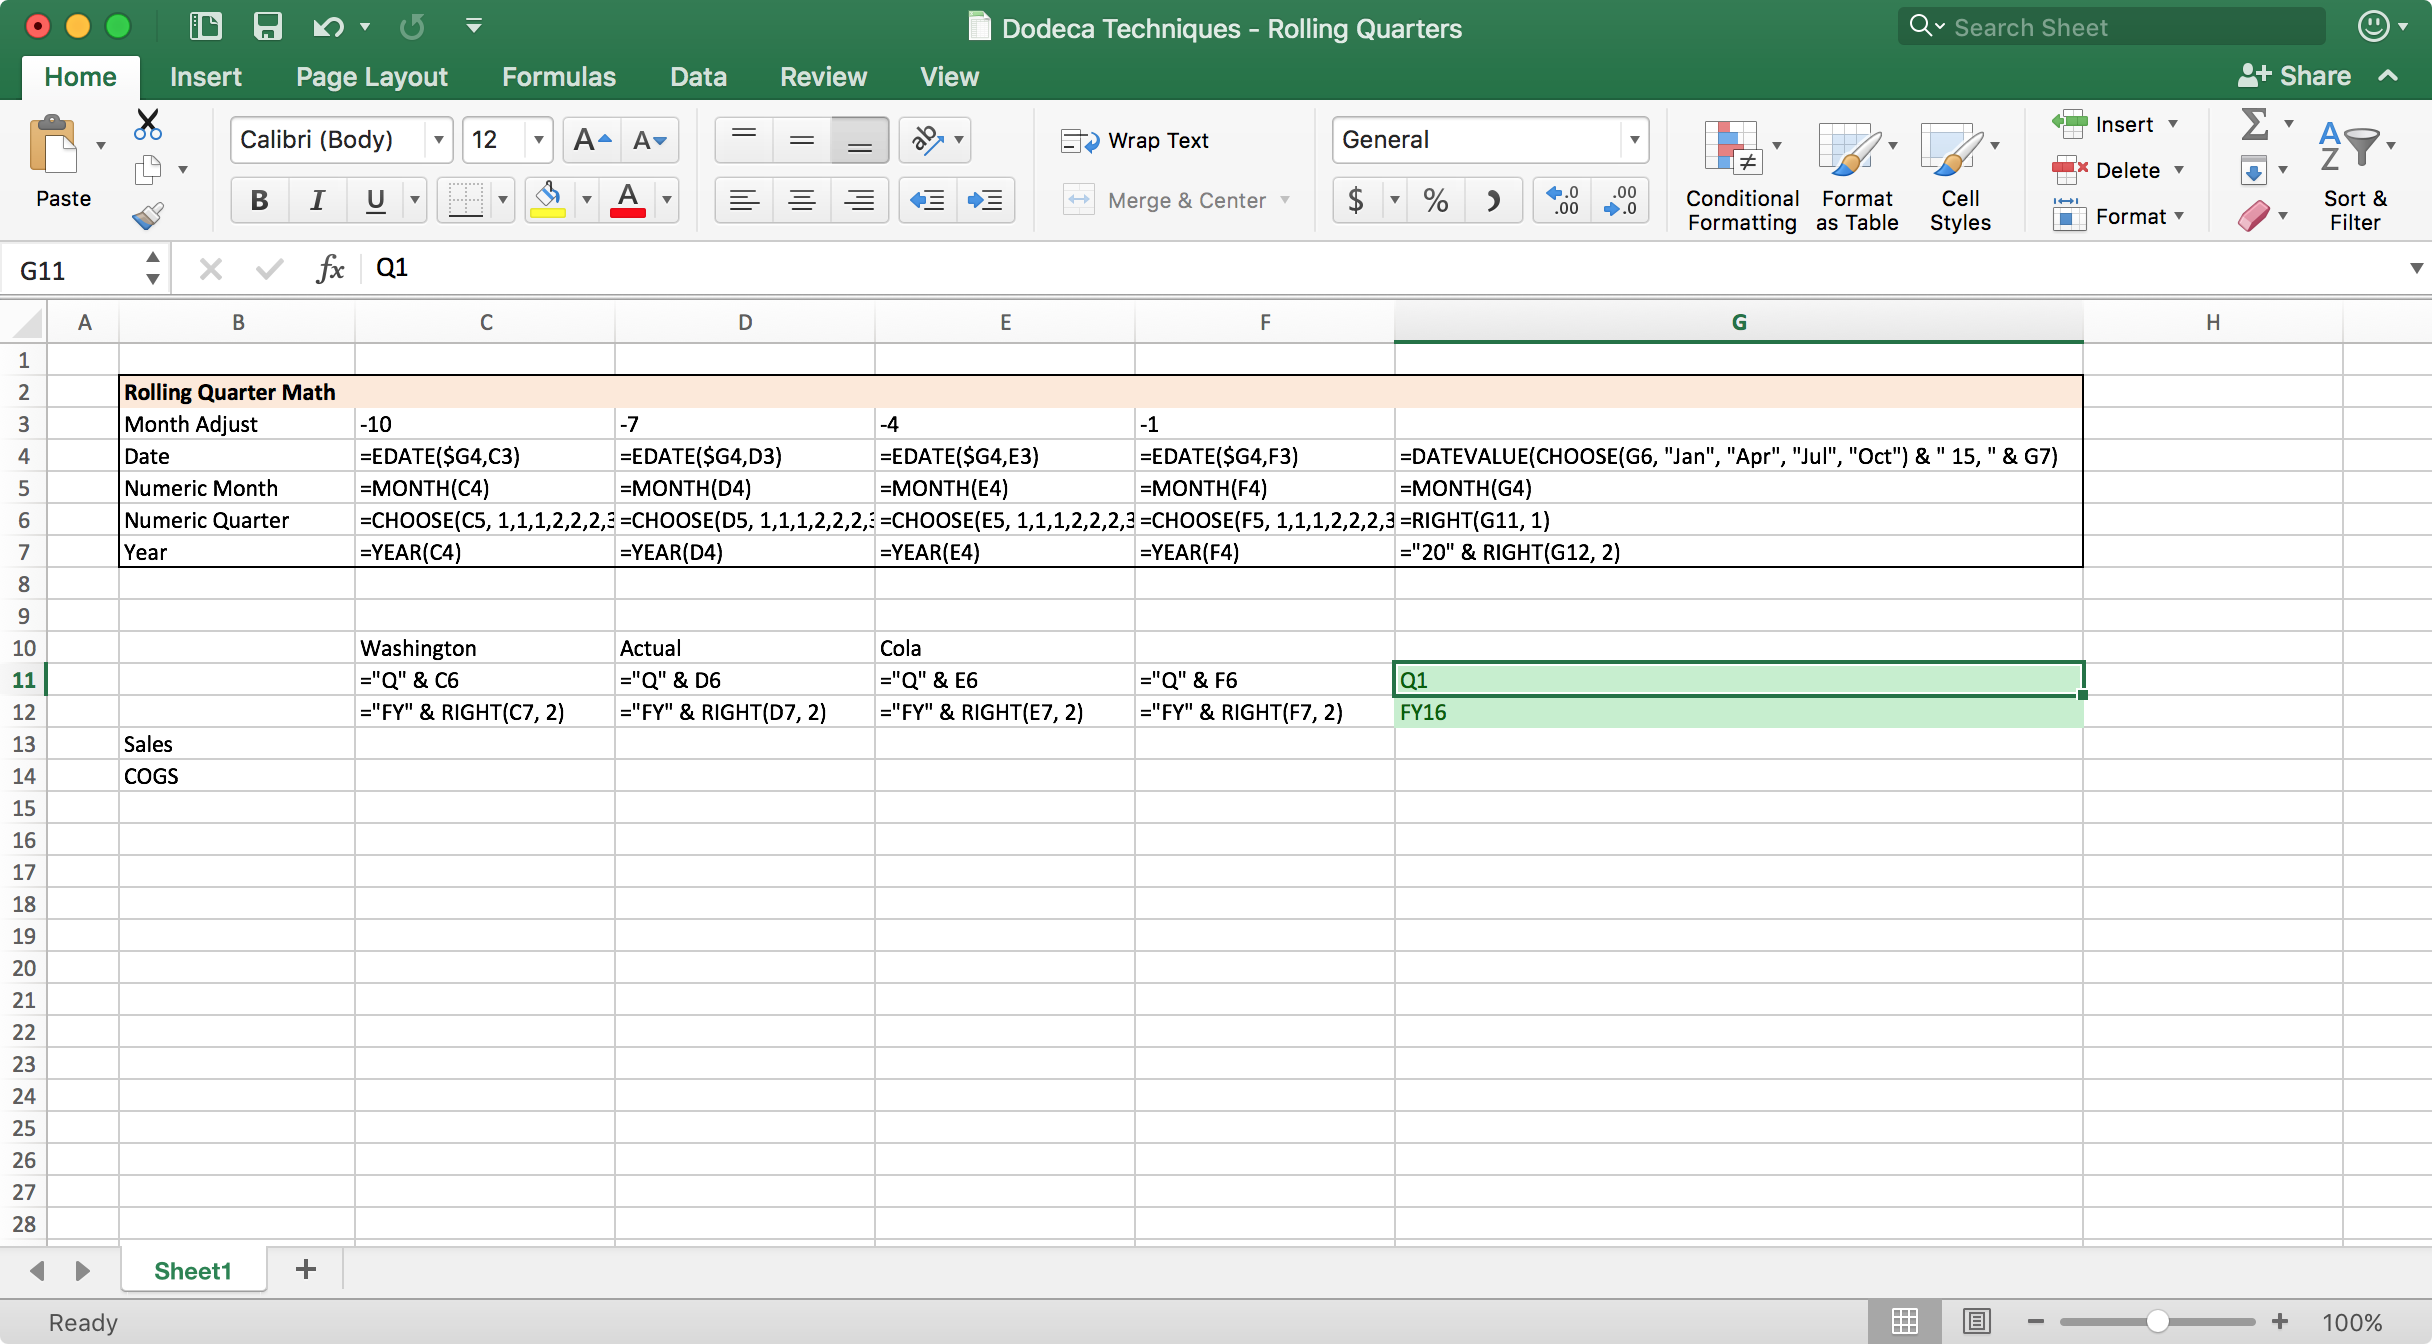
Let’s take a look at all of the formulas (again, keep in mind this is just pure Excel, nothing specific to Dodeca), to see what’s going on before walking through it:
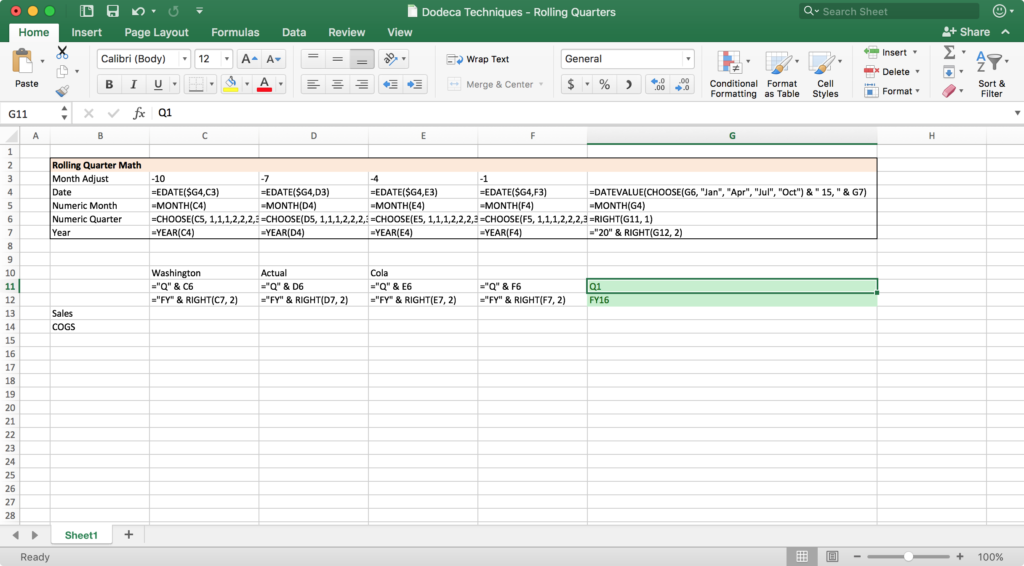
Simple Dodeca template with formula display turned on
In sequence:
- The numeric quarter is derived from the user selected quarter. Over in cell G6, This is as simple as a
=RIGHT(G11, 1). Q4 gets turned in to 4, Q1 turns in to 1, and so on.
- The quarter number is “mapped” to a month name using the
CHOOSE function in Excel, then converted to a date using DATEVALUE. This is the formula in cell G4: =DATEVALUE(CHOOSE(G6, "Jan", "Apr", "Jul", "Oct") & " 15, " & G7). The CHOOSE function is really, really, useful and powerful in this context.
- We extract the numeric month in G5 using
=MONTH(G4)
- Calculate the year, either using the
=YEAR function or building it with ="20" & RIGHT(G12, 2), depending on which column
- Up in row 3, notice that we have a “month adjust” value. For the columns to the left of the initial date column, we use
=EDATE to calculate the adjusted date based on the original date we calculated
- With the numeric month and year in hand, the formula for the cells in our actual Essbase retrieve grid are very simple now: for quarters, concatenate “Q” and the quarter number, and for years, concatenate “FY” and the two digit year.
Again, what happens with the grid is that the user makes a selection for the quarter and the year, we use Excel formulas to calculated previous quarter/year values (by way of converting to a date and using Excel date functions to do the “hard” work” for us), then build Essbase member names in the retrieve grid. That’s it. As I said, this general technique is applicable in many, many use cases, and not just for dates (although it’s particularly effective with dates).