Welcome to the fourth installment of my increasingly inaccurate EV three-part review. If you missed the first three parts, you can check out the EV background, using EV, and using EV continued parts to catch up!
I hope you enjoyed this little mini-series on a really interesting tool so far. As I mentioned in the first article, this tool has a special place in my heart owing to how critical it was to my Essbase life going back as far as 2005. I was quite the EV enthusiast back in the day within my company, but when I talked to people about trying it out or using it, it quite often fell flat. I’d often hear, “Why don’t I use the Excel add-in?” or “Why do I need another tool for that, I already have [whatever]” or “isn’t the enterprise standard [some enterprisey thing]?”
I see where these people were coming from. I get it. In a world where the tools that users are given are often prescribed quite strictly for them, having one more tool to support is matter to be taken lightly: licensing costs, support, training, and all the normal fun IT things.
For these reasons, I prefer to think of EV as another tool in the toolbox for my users – not the exclusive tool. It’s not the end-all-be-all enterprise reporting solution like Financial Reporting, and it’s also a distinct experience apart from Smart View. Consider these tools:
- Smart View
- Planning
- Financial Reporting
- Tableau
- Dodeca
- cubus EV
Then consider the following evaluation criteria:
- Ease of use / Learning curve
- Report definition handled by user or admin?
- Installation
- Data visualization ability
- Primary usage reason
- Relation to other tools
I won’t exhaustively put these all on a spectrum for each property (I’ll save that for a future post), but looking at a few of these products and these evaluation criteria, I can point out a few things.
Smart View, Tableau, and EV are all ostensibly self-serve: you just make them available to the user, they point it at a data source, and then perform analysis and reporting, much to their bean counting merriment. Planning, Dodeca, and Financial Reporting ostensibly require some administrator to have put in some structure ahead of time that the user will consume.
As for ease of use, EV certainly isn’t harder to use than Smart View, if anything it’s a bit simpler. EV makes it hard if not impossible to put your grid into an inconsistent state with respect to the underlying OLAP data source, meaning that you can’t really screw things up by moving some member to the wrong column. Easier to use than EV, however, would be Dodeca and FR. Planning gets kind of its own special place on this spectrum (it’s not easy per se, it’s not hard… it’s something). Similarly for Tableau – a bit of a learning curve, simple reports are fairly straightforward, but the sky is the limit for some of the crazy visualizations you can do.
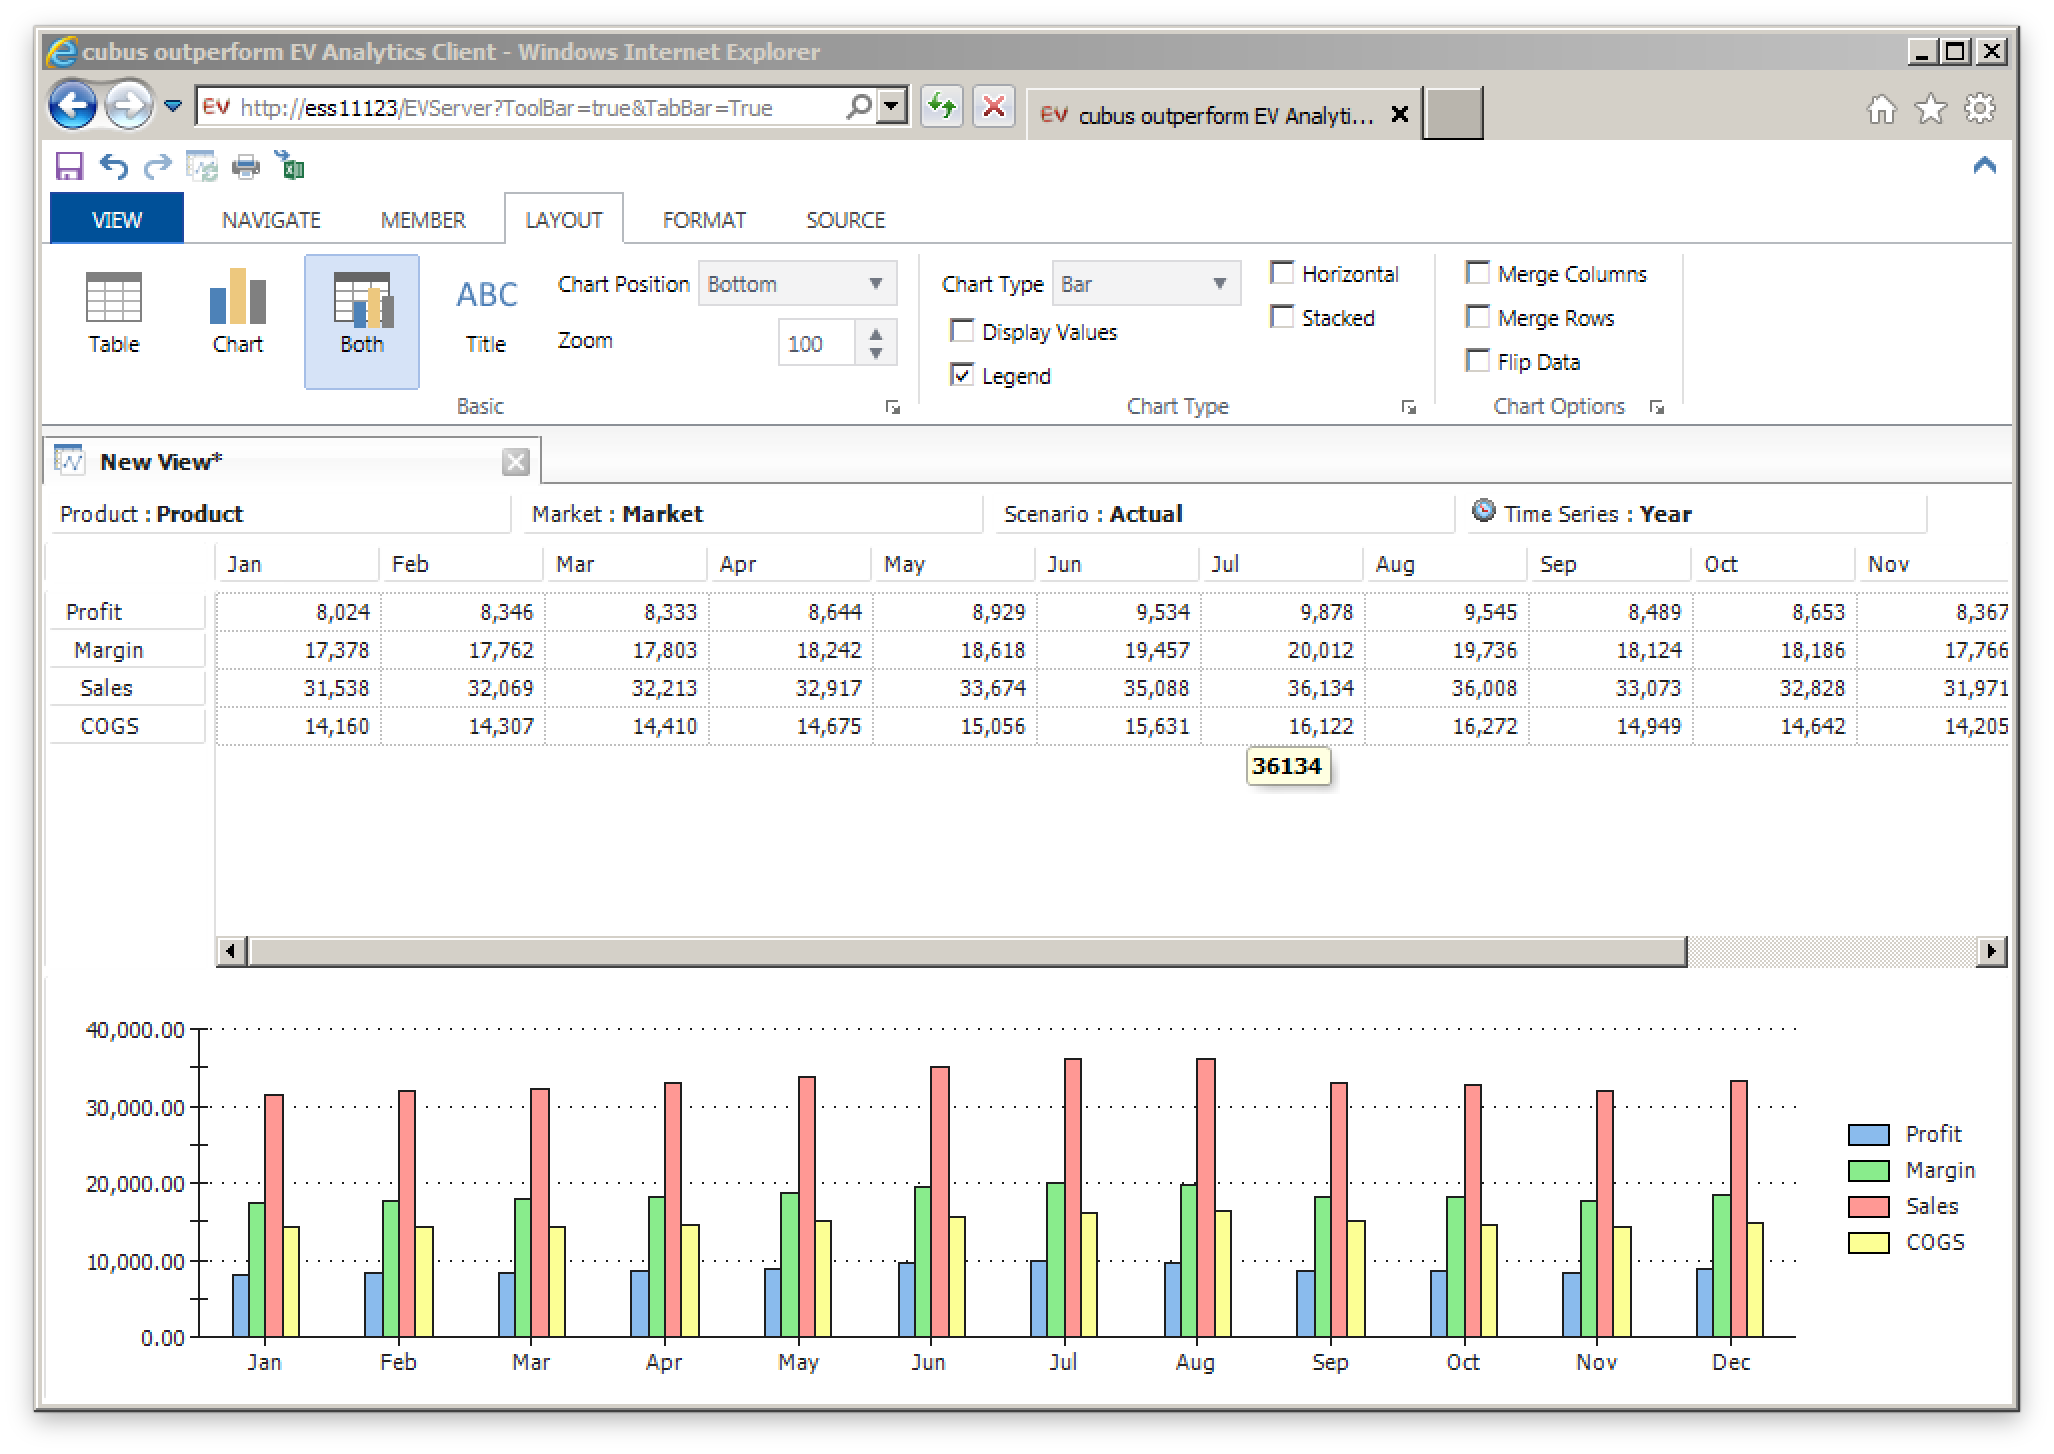
Speaking of data visualization, Tableau is quite clearly the champ out of all of these. Dodeca and Smart View have similar support for charting (by way of Excel or Excel-like charts). EV’s isn’t ostensibly a data visualization environment, but it’s visualization capabilities in terms of bread and butter charting are compelling, particularly the way that it is an absolutely seamless experience with respect to the data grid you’re working with. In other words, with Excel/Smart View you add in a chart if you want, in EV the data IS the chart if you want it to be. Or it’s just the data – or it’s both at the same time.
Installation for EV is pretty straightforward and a little better than Smart View since there isn’t an installer to worry about, so it’s nice being able to just give your use a URL and away they go. Similar props for Dodeca and most of the other tools on this list.
Final Thoughts
So what does this all add up to? I think that EV is a great tool to have IN the toolbox, but not the ONLY tool in the toolbox. Almost paradoxically it is a compelling tool for your advanced Smart View users but also for Smart View novices that may be intimidated by ad hoc queries and multi-dimensional concepts. EV rewards the user of a well-constructed cube, with a competent and functional UI that extends the value of properly deployed features, such as Dynamic Time Series, UDAs, attribute dimensions, sensible member names, and more.
On the other hand, it doesn’t seem to be for everyone: based on my own prior experience, it can be a confusing addition to the technological landscape for some IT managers (not to mention one more mouth to feed, system-wise), and might run into “But we already have X for that” syndrome. Again, I think it’s a complement and not a replacement or enterprise standard. There are countless scenarios I can imagine where if I were to be dropped into some enterprise as the benevolent dictator of all things BI (or OLAP, or EPM, or whatever), I would say “let’s take this thing out for a spin and see what people think” and would give Decision Systems or cubus a call.