Dodeca Spreadsheet Management System customers have been asking for HFM support for quite some time (some for years!) – and now we have it. For the last few months we have been testing out the new Dodeca HFM Connector with very compelling results. In order to understand how to use this new connector in your existing Dodeca environment, it’s important to understand a bit about how this connector works, and how to deploy it. I’ll cover this and more in this blog post.
Continue Reading…Category Archives: dodeca
Dodeca Dynamic Build Example & Walkthrough
Today I’m going to walk through a multi-faceted Dodeca example that shows off several different concepts and techniques. We tend to conceptualize Dodeca applications and solutions in terms of making Essbase even better and today’s example is a perfect example of how we do that.
Think about it this way: your organization spends an enormous amount of time designing the perfect cube – the proper dimensionality, formulae, calc scripts, data, and more. Often, the cube serves multiple units or departments and they each have their preferred way of looking at things: hierarchies, views, and more. On the developer/Essbase side of things the functionality is solid and feature-rich. But there may be compromises on the user/interface side of things. This is where Dodeca and the example I’m walking through today really shine. It’s a practical example of how Dodeca can make Essbase better by creating a highly focused and tailored experience for the user. Continue Reading…
People really hate VBA
Stack Overflow did a really great article on the most disliked programming languages that I thought was really interesting, with my own little Essbase twist on it. On Stack’s jobs site, they let people specify which technologies they’d rather not work with. Tops on the list are Perl, Delphi, and VBA. PHP and Objective-C are next but they don’t have near as much dislike as the top three.
So, why all the hate? To me, these all have intuitive explanations, and at least in the case of Perl and VBA, I think it has to do with the context in which “projects” with these technologies occur. Perl and VBA are frequently used as quick and dirty scripting languages to automate some process. And often these one-off automation solutions tend to grow. I could be charitable and say that these solutions grow “organically” but it’s probably more often the case that they grow haphazardly – which is perhaps also being charitable.
I think people are indicating they dislike these languages because they just don’t want to work on them and don’t have good experiences working with their sprawling, complicated, hard to debug, and incredibly sparsely documented codebases. Briefly, and skipping down the list to Objective-C, I think that’s indicated as disliked mostly because it is “out of favor” with respect to the Swift programming language. The iOS ecosystem is incredibly fast-paced and people seem to need to aggressively keep their skills fresh.
As it pertains to Essbase, I couldn’t help but think of my own corporate and consulting experience when it comes to VBA solutions. I can’t tell you how many times I got a call because there was a problem with some workbook that had some VBA code on it. It can be incredibly frustrating (and in the case of bringing in a consultant, expensive) to debug, fix, and enhance these solutions.
Quite simply, while the VBA-based solutions provide something valuable (automation, saved time, etc.) they become an absolute albatross in finance departments and make upgrades/migrations just that much more difficult. That’s one of the reasons that I think Dodeca is such an effective solution in numerous cases where VBA was used, because many of the things you needed VBA code for are just inherent features of the product, with zero code at all.
For example, without a single line of code, Dodeca can connect to Essbase, pull members from an outline and present them as dynamic selections to users, retrieve multiple cubes into multiple ranges on multiple tabs in a workbook, send data back to Essbase, and run calculation scripts. These are features that typically make up pages and pages of low-quality, low-value VBA code and often necessitates the continued usage of the old, unsupported classic add-in.
Dodeca 7.3 Workbook Scripts Enhancements Overview
Today I’d like to continue on the theme of new functionality in the latest release of Dodeca, version 7.3 that came out some time ago. I talked about the new Outline Viewer functionality and MDX enhancements already, today I wanted to give a brief overview of some of the new functionality in Workbook Scripts (WBS).
If you’re not familiar, Workbook Scripts are optional scripts that can be added to views that provide advanced functionality inside of views. You can think of it as a modern, more maintainable analog to VBA, optimized to work in a world of Essbase-based data on spreadsheets. Dodeca 7.3 included some new methods and functions. There’s also updated Dodeca 7.3 WBS documentation available on the web.
New & Updated Procedures
CopyFromBinaryArtifact
The new CopyFromBinaryArtifact method is potentially the most interesting new method to show up. There are overloads for copying a whole sheet or copying a range from a particular binary artifact (i.e. a completely separate Excel sheet than the current view). So this potentially allows organizations to centralize some information, formatting, data, or other stuff into a central sheet, then refer to it. I could see people using this to store small amounts of data that they want to reuse in a view (thereby obviating the need to put the data in a bespoke relational table/cube), or copying some common formatting elements into a new view. So, this new method potentially opens up some significant maintenance savings and other possibilities in a lot of cases
OpenApplication
OpenApplication can be used to launch a different application instance from the current one. This can be useful for user convenience, where instead of telling the user that they need to go to a separate app, you can launch it for them.
SaveWorkbookAsCsv
The SaveWorkbookAsCsv method is pretty much what it sounds like. In addition to being able to save the workbook as a CSV file using the UI, you can perform this via WBS. I see Dodeca used in many cases providing some quasi-ETL functionality, or being used for large data dumps, so this could be handy. For example, maybe you want to allow users to drill into relational data and then automatically download it to their desktop.
AddDataCache: EssbaseMDXScript
There’s a new EssbaseMDXScript overload available as part of AddDataCache. The Data Cache functionality is really handy in many instances, especially where you want to execute an “expensive” (in terms of query time) query but then be able to do multiple things with the data without having to re-run the query. Now you can cache data based on an MDX query in addition to the normal options with report scripts, SQL, and more.
SendEmail (new Zip options)
SendEmail gained a couple of new properties to zip attachments. This method is already used quite heavily to have Dodeca generate and email large, complex books of reports (Excel and PDF) and mail them around. This is quite frequently used as part of batch reporting. This functionality is used so extensively by so many organizations that it is now useful to compress the output into a single file and attach that to the email. Now with a single option you can do exactly that.
Miscellaneous
There are a few other tidbits here and there like a new attributes property on the EssbaseReport method, some new convenience functions like getting the first column letter, last column letter, checking if a binary artifact exists, if a view is shared, and more.
Read the Release Notes!
The release notes that ship with the Dodeca distribution contain pretty detailed notes on all of the new functionality and features, so be sure to peruse those for other new functionality you might be interested in. If you are planning to use some of these new procedures/methods, please let me know if you do and how useful you find them, I’d love to hear about it.
Dodeca: Turn on Auto Build button by default or hide it entirely
A customer request came in the other day asking if it’s possible to turn the Auto build button on by default. You can see this button next to the green build button in this screenshot:
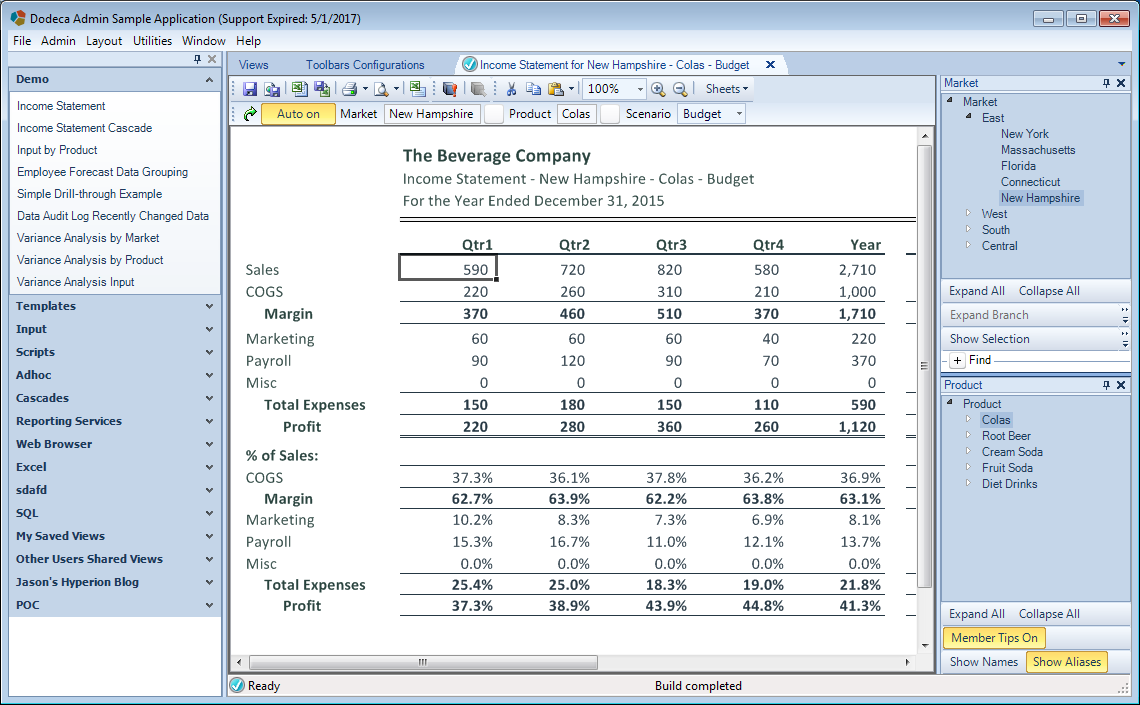
Validating in our view that the Auto on button was indeed on by default
Given a default set of toolbars that ship with Dodeca, this button typically starts in the “off” state. In case you’re not familiar, the effect when it’s on is that any time you change an item in a selector, the current view will be rebuilt. This can make it really convenient to browse through different views of data without having to press the build button (you can see this in the video at the end of this article). It’s just one of those usability things that makes interacting with data just that much more fluid.
Dodeca: Create and use a new Essbase MDX Selector List
The most recent version of Dodeca brought several exciting enhancements for MDX-related functionality. One of these is a new selector list based on a reusable MDX script object. Although MDX queries are probably most often associated with queries that return numerical data from a cube, they also have incredibly useful metadata capabilities that can be employed for various purposes. In Dodeca, it’s common to use a report script or member query specification to return members from an outline. For example, you might want to provide your users with a selector such that they can choose a particular product (or products) from your Product dimension in order to customize a report that they will build dynamically.
I see MDX scripts as being a natural, clean, and flexible way to populate these selectors, and moving forward I will recommend them whenever possible over the more arcane report scripts that have been around for years.
That all said, what I want to show today is the following: I’m going to edit an existing Dodeca view so as to replace one of its existing selector lists with a new list based on an MDX query.
My Favorite New Dodeca 7.3 Feature: Outline Viewer
Dodeca Spreadsheet Management System 7.3 was officially released last week (I was down at Oracle OpenWorld so have been a little busy to write!). This release brings numerous enhancements and improvements (more on that later), but I wanted to go over one of the more visible new features.
This release of Dodeca brings a new view type, OutlineViewer – and as the name implies, it’s for viewing an outline. There are a great many use cases for this feature, and I believe that many organizations will find a great deal of benefit from it.
First and foremost, a lot of companies I’ve been at and done work for frequently need to give EAS access to power users so they can view the outline. This is frequently a security and logistics nightmare. It’s a security nightmare because this user typically needs one-off security grants to view a given outline. It’s a logistical nightmare because EAS isn’t the most friendly tool (plus it’s going away anyway), and it becomes one more piece of software that needs to be managed. You can hand out the JNLP link, but then there are frequently issues with Java that finance users will run into, let alone developers.
More on Dodeca Dynamic Connections: Allowing Users to Select Multiple Connections
Last week I wrote about how you can configure user selectable Essbase connections on a Dodeca view. One of the comments on the blog article was from a Dodeca customer that said, “Hey, that’s great and all, but what about a Dodeca view with multiple Essbase connections?” In other words: Can we setup a Dodeca view that pulls data from multiple user-selectable connections and have data from different connections on the same sheet? The answer is yes – although the configuration is just a tiny bit different than what I thought it would be (it was actually simpler). This blog post will walk through how to set this up.
Dynamic Essbase Connections in Dodeca: Faster Cubes and an Enhanced User Experience
The other week I showed an innovative approach to providing user-selectable Essbase connections from a Dodeca view. I’m going to continue on the subject of dynamic Essbase connections this week, but with a bit of a twist. I’m really excited to show this technique off because it’s a perfect combination of showing the flexibility that Dodeca provides, but perhaps even more importantly it speaks so strongly to our raison d’être: making Essbase better.
Current Cube vs. History Cube
Many organizations spin off a copy of their cube each year or periodically when they need to boost performance a bit. Typically the major win for performance here is that you can drop a year or more of data, often by literally deleting a member or two from the Years dimension. In an ASO cube, this can significantly cut down on the amount of data in play (thereby increasing some combination of load and query performance), and in BSO databases, the effect can be even more dramatic, particularly depending on whether years is sparse or dense. Years (FY17, FY18, etc.) is typically a sparse dimension, but is sometimes dense, which could yield even more reasons to try and keep it as small as possible.
User Selectable Cube Connections in Dodeca
A request came in the other day asking if it was possible to make a Dodeca view’s connection dynamic/selectable by the user. For example, say you are rotating through cubes every month that are essentially the same outline but just have different data. You might have the January cube, the February cube, and so on. This is a somewhat unorthodox, but certainly not unique design approach that I have seen over the years. Among other things, this approach can help keep a cube very manageable/fast when an organization’s data needs and processes might otherwise require an entirely new dimension or other dimensional shenanigans in order to facilitate the necessary reporting, planning, and forecasting activities.
To start, since connection objects in Dodeca are centrally managed it is certainly possible to just update the connection details as needed and point to the proper cube. But in this case we need a little more power. Can we let the user choose the connection for their own Dodeca view? Absolutely. I’ll show you how in this article. Continue Reading…