The last article on relational data input with Dodeca was a bit epic – I was planning on something a little shorter and sweeter for this next article, but it’s going to be another long (but awesome!) one that combines everything we’ve seen so far in this data input series, and more. To recap, the series so far has consisted of the following articles:
Let’s get crazy today with a soup to notes implementation where we’ll input relational data and then load it to Essbase automatically so that the data ties out. You might call this “home-brew hybrid”. As with before, it’ll be based on our favorite database in the whole wide world, Sample/Basic.
Consider the Sample/Basic dimensionality: Year (time periods), Scenario, Market, Measures, and Product. The use case that I’m going to look at today will cover the scenario where we want to prepare a budget, by product, by time period, by region, but have it be by employee. But this dimension doesn’t exist in the cube – no problem! Let’s further stipulate that for either architectural, performance, or other reasons, we absolutely do not or cannot put in an Employee dimension. So what we’re going to do is have Dodeca facilitate inputting data by employee and feed that into a relational database, then we’re going to use some simple Dodeca automation (workbook scripts) to take the sum of the data we input (for the given time period and market and so forth), send it up to Essbase, do a focused calculation on the cube, and then retrieve the updated data to show on the exact same sheet that we’re already on.
Adapt the Tool to Your Business, Not Your Business to the Tool
I think it’s worth pointing out that that the basic foundational element in Dodeca – the venerable spreadsheet – is an almost infinitely flexible canvas upon which we base our reports. There is a lot of software out in the world that gives you enhanced productivity (versus rolling your own solution from scratch) but imposes certain constraints on your solution. For example, consider two different software applications for the task of writing a résumé: Microsoft Word versus some specific resume-writing software. Microsoft Word is the “infinitely flexible” option: it can write résumés, letters, reports, shopping lists, or whatever. On the other hand, the special résumé-writing software might make it really easy for the user to crank out a good looking résumé in short order, perhaps choosing from several template options (to be fair, Word has some built-in functionality and templates for résumés too but let’s pretend that doesn’t exist or that the special software is otherwise still more productive and compelling). The specialized software, however, is going to have a more limited number of use cases. So it’s up to use – the users, the admin team, whatever – to decide what we want: the generic software, the special software, or both.
As it pertains to Dodeca, however, the central spreadsheet paradigm gives us this infinitely flexible environment to work in while simultaneously letting us an astounding amount of experience with spreadsheets and Excel. And I think this hybrid input example is a particular poignant demonstration of this power: we are not limited to a single technology in a sheet, or a single connection. Dodeca let’s us seamlessly blend Excel functions, formatting, SQL retrievals, SQL input, Essbase retrievals, Essbase input, a procedural scripting tool, and more, all in a single view.
So rather than having to arbitrarily break this business task up for technical reasons – perhaps into multiple views, multiple steps, whatever – we can easily design it exactly the way we want the user experience to be.
Concepts & Techniques
This post is going to show off a lot of Dodeca features and techniques. In no particular order:
- SQL data on a view (SQLPassthrough Data Sets)
- Essbase retrieval data on same view
- Sending data back to relational database
- Selectors allowing only certain members to be used (such as only level-0 members)
- Excel formatting
- Hidden send range on sheet
- Hiding rows/columns
- Cell references to link data between locations on a sheet
- Workbook Scripting to automate data submission task
- Automatically executing a server-side calc script
- Using a custom POV to focus the calc script
- Hiding rows with Essbase member names in order to show a “nice” name instead
Let’s Do This
The following sequence of screenshots and text is going to describe the start to finish (or soup to nuts) process of creating the desired view of data in Dodeca. Parts of this will overlap with the earlier posts in this series.
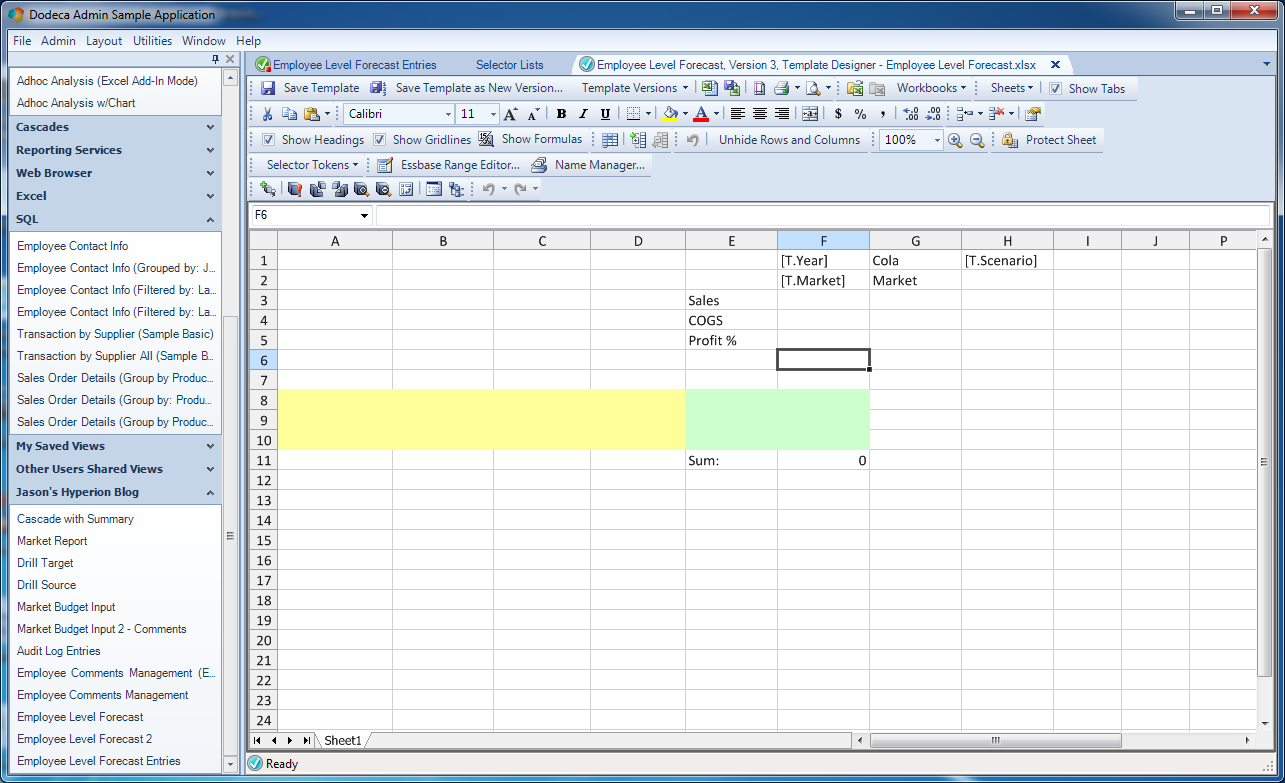
First thing’s first, we will start with our basic template. It’s going to look a little weird at first, but hang with me and I’ll lay out where everything goes, why it goes there, and toward the end we’ll totally clean it up into a really nice looking, highly functional view. Here’s the basic template that I whipped up to start things off:
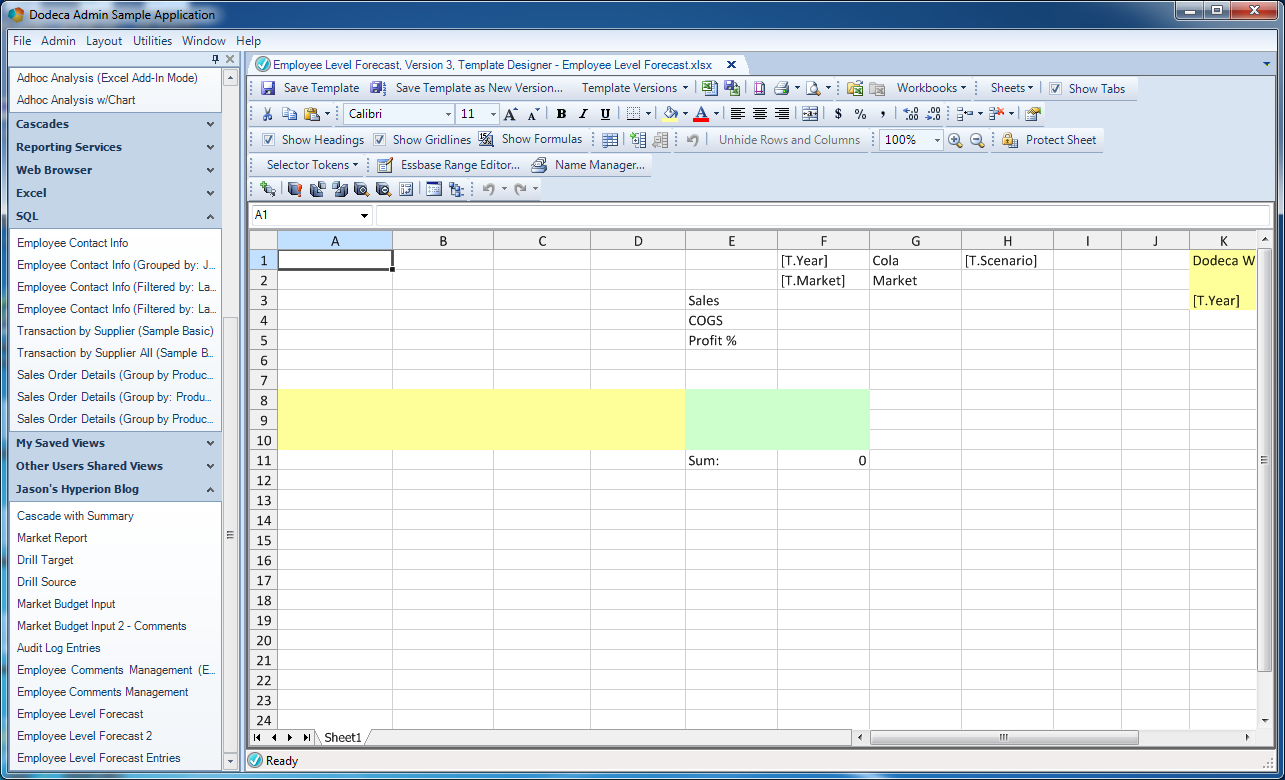
Initial Dodeca hybrid input template
You can’t quite see it yet (I’ll go over it in the next few steps), but there are three “sections” in this template. This first section (range) I want to bring your attention to is the normal Essbase retrieve range:
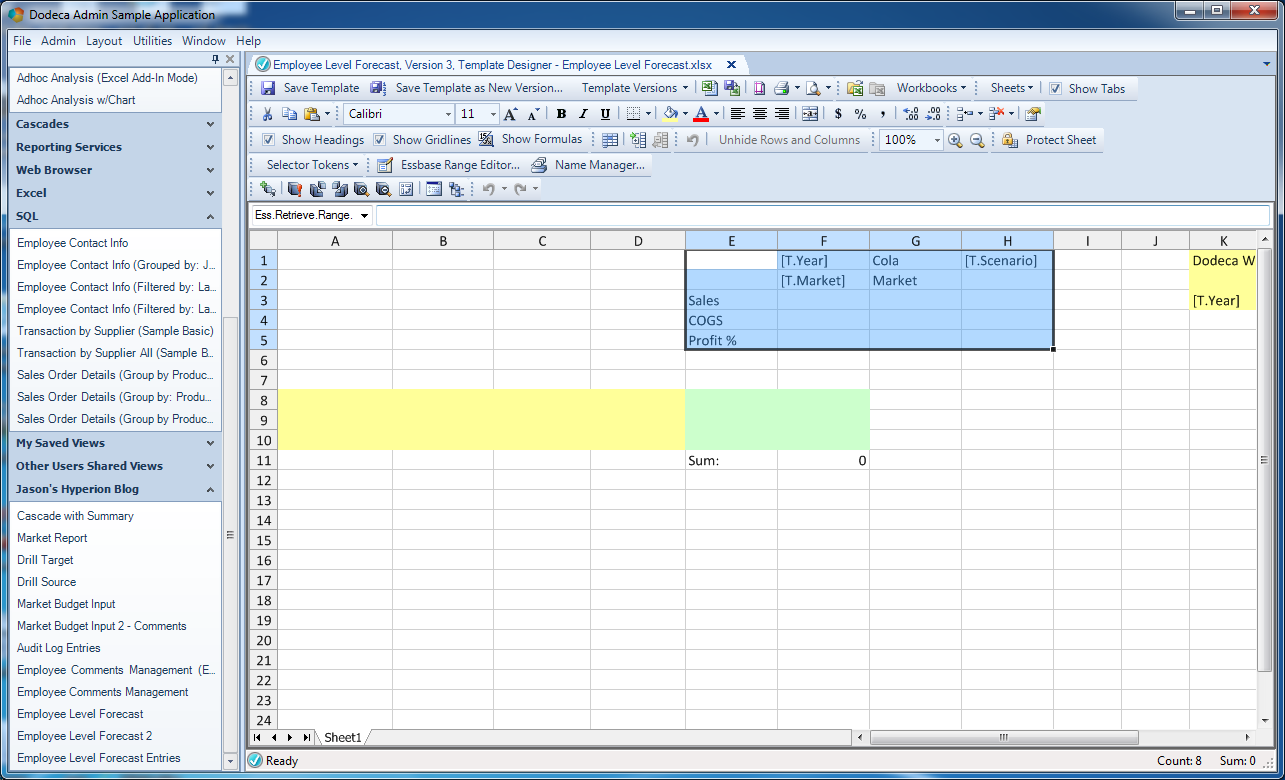
Essbase retrieve range on Dodeca template
This is the part of our template that is more or less just a straight pull of data from Essbase. When the view is built, the range is retrieved (using the user’s selected values for the Year and Market dimensions), showing what the current values are in Essbase. This template itself is going to be used to update that very same data, so where we’re going with this article is that we are going to input data in the SQL/relational range, send the sum back to Essbase, then immediately retrieve it. The user won’t be entering any data directly into this range.
I want to point out specifically a couple of other things about the dimensions for this example. As I just mentioned, the Year and Market dimension members will be chosen by the user. As you’ve seen in other articles, the user-chosen values will be populated for the tokens T.Year and T.Market. But also notice that there is a token for the scenario ([T.Scenario]). I’m going to get into this later in the post, but this is actually going to be token that is specified on the view itself. In other words, I don’t need (or want) the user to choose the scenario, since on this input template it’s just always going to be Budget. So I can just plug it in at the view level.
Lastly notice that I decided to hard-code the product. This is purely for illustrative purposes where we’ll also make the assumption that these users are perhaps in the Cola division and this dimension will always have the value of Cola. It’s much more likely that in reality this would be configurable, but as you’ll see in the upcoming queries and other functionality, I wanted to show a nice blend of hard-coded values, selector values, and dynamic tokens/placeholders to give you a feel for what the possibilities are.
The second of three sections on this sheet is an Essbase send range, shown in yellow:

An Essbase send range
This range is purely a “work area” for us – it’ll never be shown to the user. This is a very common Dodeca technique where we leverage all of the power and functionality of spreadsheets to compute something, and then “do something with it”. Another way to think about it, perhaps, is that as opposed to needing to learn some custom scripting language, or the Java API, or whatever, our solution/view architecture borrows concepts that we are already very familiar with (thereby decreasing the learning curve and enhancing productivity). In this case, we can think of our goal simply as wanting to somehow create a normal lock and send data submission grid, then send it up to the Essbase server.
As with before, the send range is named (Ess.Send.Range.1) according to Dodeca’s expectation of named Essbase send ranges (i.e., a range with a name starting with Ess.Send.Range. will be automatically recognized as needing to be retrieved against an associated Essbase cube).
The third section of note on the Dodeca template is a range for the SQL data (our SQLPassthroughDataSet), and is given an arbitrary name (in this case, EmployeeForecast):
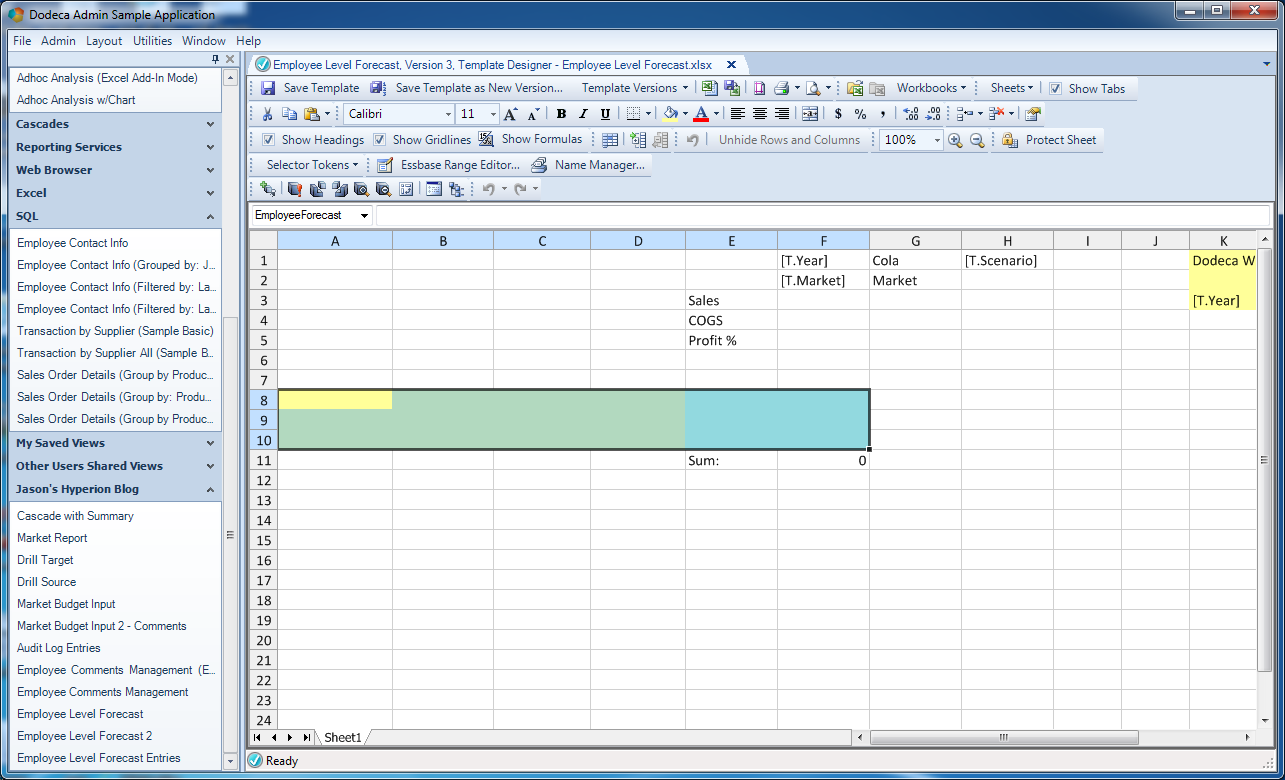
SQL input range
As you’ll see momentarily, the actual number of columns that we are going to show to the user is two (the employee name and the amount). The other columns are going to be hidden from the user. These hidden columns include the primary key (an integer), the market, time period, and product. In this case all we really need is just the primary key (so that Dodeca can identify a particular row in the dataset), the employee, and the amount, but rather than create a new query object (with fewer columns), I opted to just leave the extra columns in and just hide them for the final template. Either way works just fine, although with this technique I could potentially reuse the SQL query object more easily on some other sheet.
Before moving on, take a look below this SQL range, at cell F11. It currently shows a value of 0. This cell’s value is actually a formula: SUM(F9:F10). Although it is 0 in this admin view of the template, when data is loaded from the SQL table, it will fill the columns, and the cell with the sum formula will update, simply by virtue of being an Excel formula. Further, the way that rows will be inserted into our our range is via inserting a row, and again, leveraging the way that Excel inherently works, the range referred to by the sum cell will naturally grow to include the new rows, with no magic or code needed on out part.
With the template roughly laid out, we can now turn our attention to the SQL Passthrough DataSet. For an introduction to how these work, feel free to check out the previous article about relational data input with Dodeca. In a nutshell, however, think of a Dodeca SQL Passthrough DataSet as a smart definition of SQL data (using a particular and defined SQL connection) that at a minimum knows how to SELECT certain rows from a table/view, and optionally can be configured to know how to insert, delete, and update new rows. We define all of this behavior in a given SQL Passthrough DataSet object, and can then leverage this definition across a single view or multiple views. Over on the SQL Passthrough DataSet management interface, you can see that this one has one particular query defined, and three test tokens (more on that in a moment).
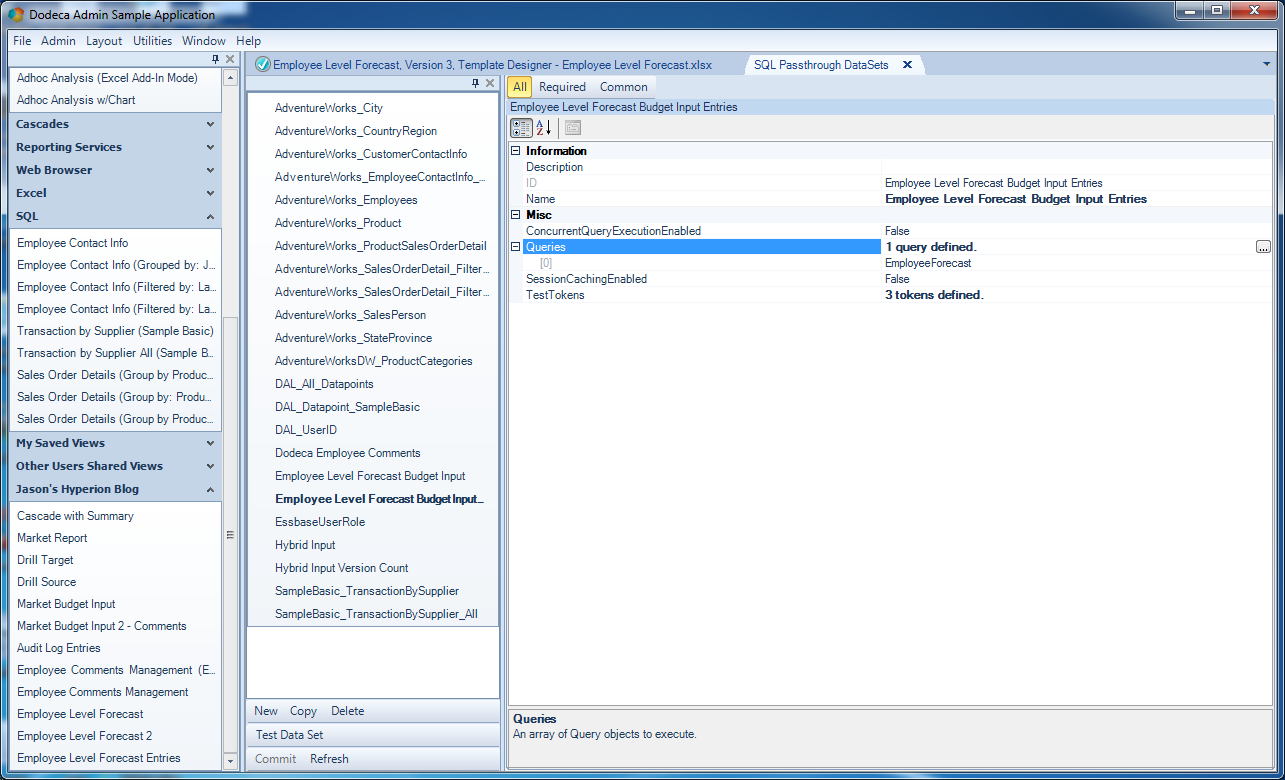
SQL Passthrough DataSet configuration
Opening up the query definition for this SPTDS, you can see that the SQL connection has been configured (simply chosen from a list). In this case I have also mapped out the columns with data types, and defined the primary key. Some database types don’t need this to be configured manually, but it doesn’t hurt to define it. Next, note that there are queries defined in the SQL category (DeleteSQL, InsertSQL, SelectSQL, and UpdateSQL). These are usually tokenized/parameterized queries that Dodeca uses in conjunction with the tokens from our view (selectors, view tokens, application tokens) to execute queries. You might be thinking that it’d be nice if you could just give Dodeca the name of a table and be done with it. But the act of updating a table can and usually does have quite a few nuances, particularly in terms of which columns should be updated, with what, what default values there are, and so on.
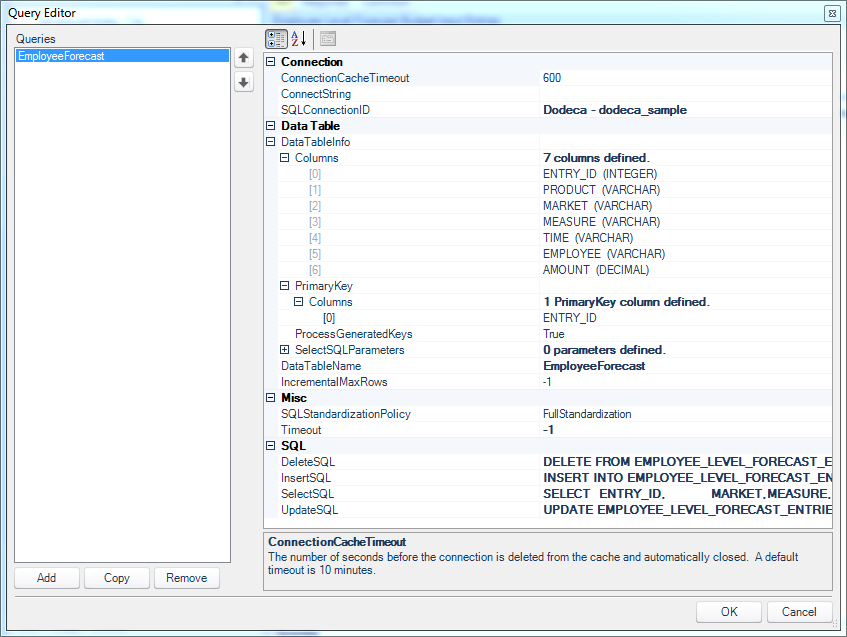
Query editor for Employee sales dataset
Let’s go through the definition of each query. To start off with, check out the DeleteSQL query:
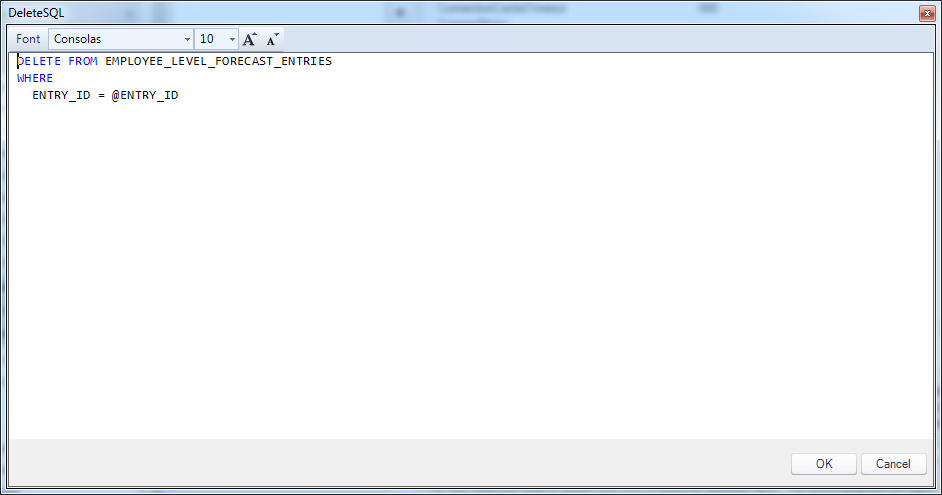
Employee sales forecast delete query
For completeness, here is the SQL code in text form:
DELETE FROM EMPLOYEE_LEVEL_FORECAST_ENTRIES
WHERE
    ENTRY_ID = @ENTRY_ID
The DELETE query is pretty simple. The only thing we need to do to delete a column is to identify it by it’s primary key value. You’ll notice the special @ENTRY_ID token. This is not to be confused with a normal view token in Dodeca. This is a token value that comes from the data table on the view itself. Dodeca knows each column in our dataset, and we can refer to any value we need by using the @TOKEN_NAME syntax. And that’s exactly what we’re doing here. When/ the user selects a given row and clicks on the delete toolbar button, a string of actions is kicked off, but at the most basic level, what happens is that Dodeca takes the context of the current row (the column name to value associations), then runs the DeleteSQL query, having plugged in the appropriate values in the placeholders.
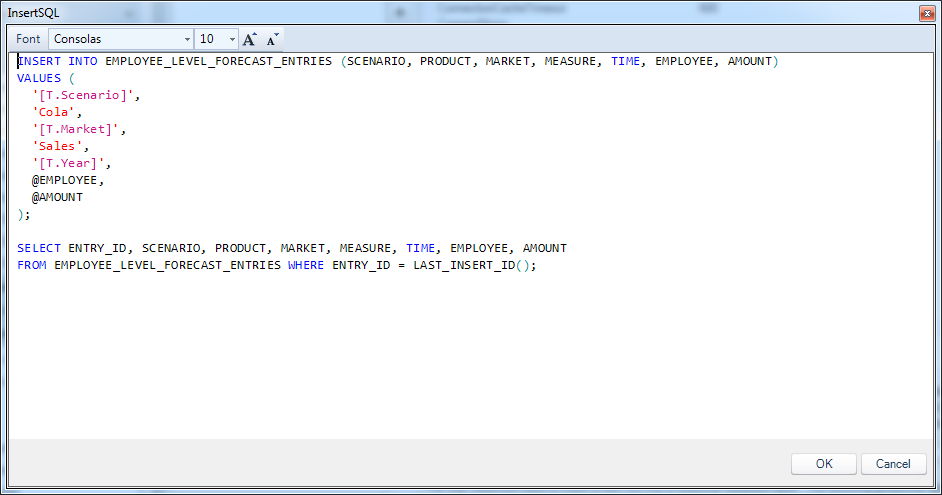
Now let’s take a look at the InsertSQL configuration:
Dodeca insert and post insert statements
The code:
INSERT INTO EMPLOYEE_LEVEL_FORECAST_ENTRIES (SCENARIO, PRODUCT, MARKET, MEASURE, TIME, EMPLOYEE, AMOUNT)
VALUES (
    '[T.Scenario]',
    'Cola',
    '[T.Market]',
    'Sales',
    '[T.Year]',
    @EMPLOYEE,
    @AMOUNT
);

SELECT ENTRY_ID, SCENARIO, PRODUCT, MARKET, MEASURE, TIME, EMPLOYEE, AMOUNT
FROM EMPLOYEE_LEVEL_FORECAST_ENTRIES WHERE ENTRY_ID = LAST_INSERT_ID();
This is the most interesting query of all of the configured queries. There are actually two queries here – the main INSERT query, followed immediately by a “post-insert” query. I talked about this a little bit in the last post as well, so for more details (also regarding some of the nuances between primary keys in Oracle vs. SQL Server vs. MySQL) check there. Let’s start with the INSERT query.
Again, our table has a primary key (an automatically incrementing integer value), and several columns. When we perform an insert, we are going to use normal SQL syntax to simply specify each column, but we’re not going to specify anything for the primary key column (ENTRY_ID). This is basically us saying that we want to let the database engine plug in a value for us automatically. Next, notice the corresponding VALUES that are to be inserted. I have three different types of things here: hardcoded (literal) values (such as Cola and Sales), selector token values ([T.Market], [T.Year]), a view token ([T.Scenario]), and SQL DataSet tokens (@EMPLOYEE, @AMOUNT).
As with the DeleteSQL configuration, when a user inserts a row to the table and saves it, Dodeca takes the current selector token values, the current view token values, the context from the SQL table, plugs them in to the query, and executes it.
As a somewhat special nuance to our InsertSQL configuration, we have a semi-colon delimiting the INSERT query and our “post-insert” query. The post-insert query is specifically crafted (in this case, it’s particular to the MySQL database semantics, what with the MySQL-specific LAST_INSERT_ID() function). Dodeca will immediately execute this statement so that it can fetch back the value that was generated for the primary key by the database. This is necessary in order for Dodeca to properly marry up the data on the grid with the data in the table (in other words, Dodeca needs a way to associate the grid data to the data in the table via the new primary key).
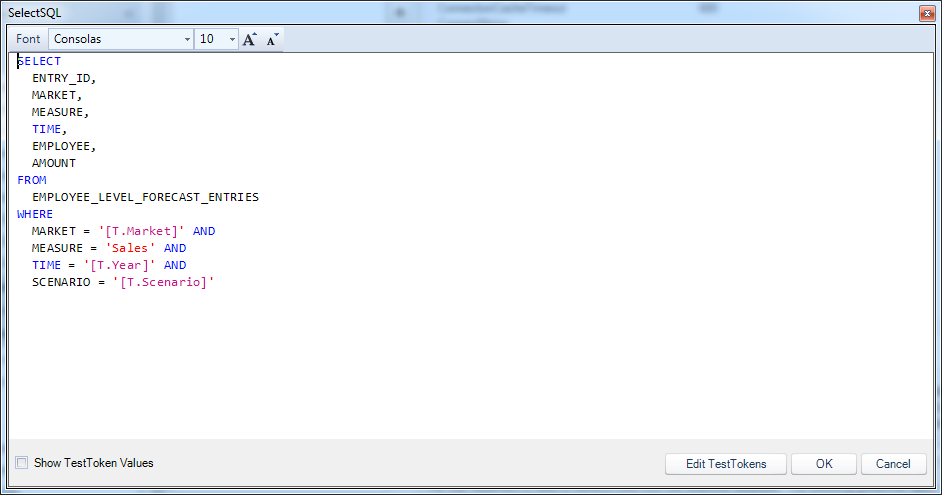
Moving on, let’s take a look at the SelectSQL configuration:
Employee forecast SELECT statement
The SELECT statement code:
SELECT
    ENTRY_ID,
    MARKET,
    MEASURE,
    TIME,
    EMPLOYEE,
    AMOUNT
FROM
    EMPLOYEE_LEVEL_FORECAST_ENTRIES
WHERE
    MARKET = '[T.Market]' AND
    MEASURE = 'Sales' AND
    TIME = '[T.Year]' AND
    SCENARIO = '[T.Scenario]'
The SELECT SQL can be thought of simply as the query that returns the data you want to show in the table. This will often (but not always) be written to include one or more tokens from the selectors on the view. In this case, I’m narrowing the query to bring back just data relevant to the current market, time period, and scenario (again, using the two selector-based tokens of [T.Market] and [T.Year], and the view token [T.Scenario]).
Lastly, we need just one more query in order to be nice and full featured, and that’s the UPDATE query:
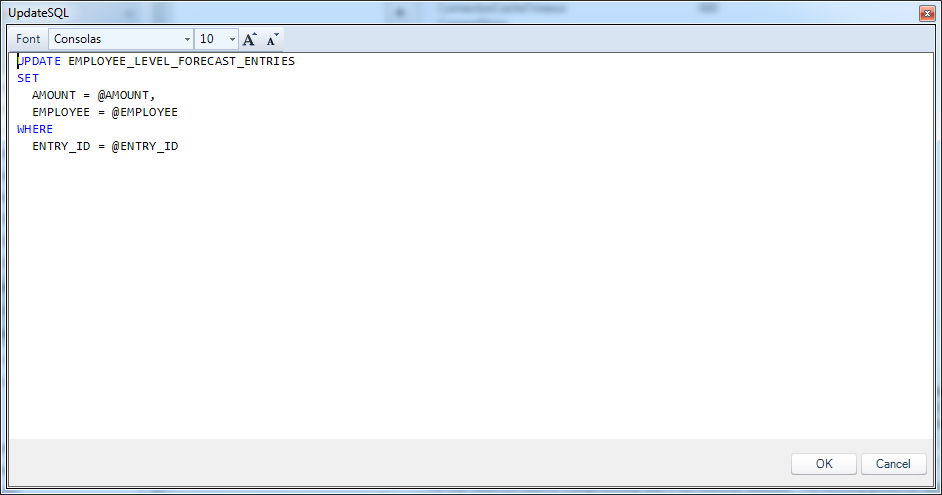
Employee forecast update statement
And the code one more time:
UPDATE EMPLOYEE_LEVEL_FORECAST_ENTRIES
SET
    AMOUNT = @AMOUNT,
    EMPLOYEE = @EMPLOYEE
WHERE
    ENTRY_ID = @ENTRY_ID
The update query generally identifies a particular row by way of its primary key (WHERE ENTRY_ID = @ENTRY_ID), and only updates values that have changed or otherwise need to be changed. In this case, we only need to update the AMOUNT and EMPLOYEE column values, because in this view, we’re effectively saying that a user can’t just change the market, time period, or scenario of a a given row (there are cases where we might want to do that, of course, in which case, we might configure the SQL a little differently or perhaps use a small script to handle the data movement/reclassification).
Okay, that’s a good bit of configuration for our SQL Passthrough DataSet. The really nice thing about this architecture is that we can reuse this same definition across multiple views, which will save us time down the road, in addition to increasing maintainability.
Before moving on, it will be good to test the data in the data set. Of course, since the SELECT query references token values, we’ll need to provide some values for Dodeca to test with. This is easily accomplished with the relatively new Test Tokens functionality. This functionality allows us to define (and save) sample values for any number of tokens, such that they will be used when we preview the data set. Here’s my definition of test tokens:
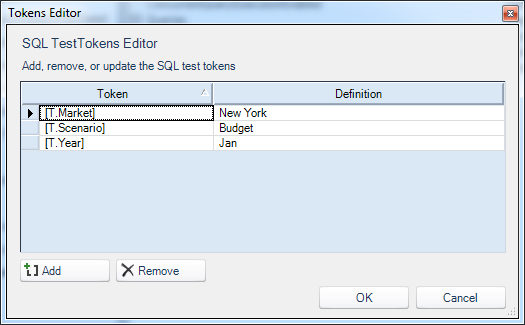
And when I click on the Preview button, I get this data from the table, using the tokens I just defined to execute the sample query:
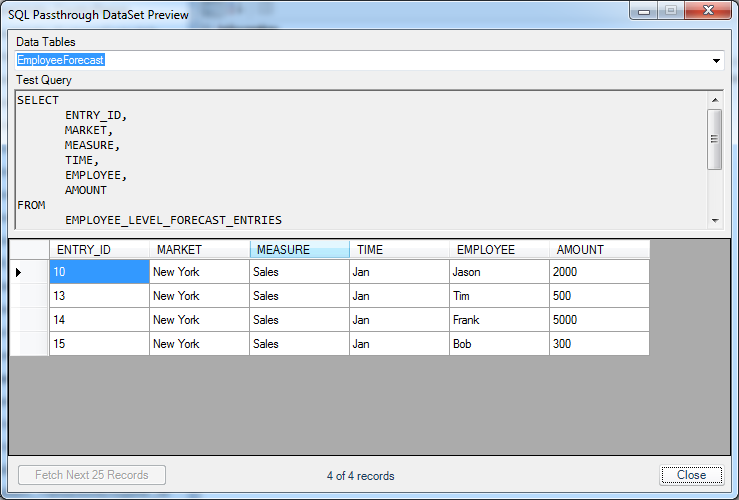
Employee forecast DataSet preview
The query executed successfully, so things are looking good. This is a good chance to make sure the basic plumbing of the view is working, without having to copy/paste it into a SQL tool or something else.
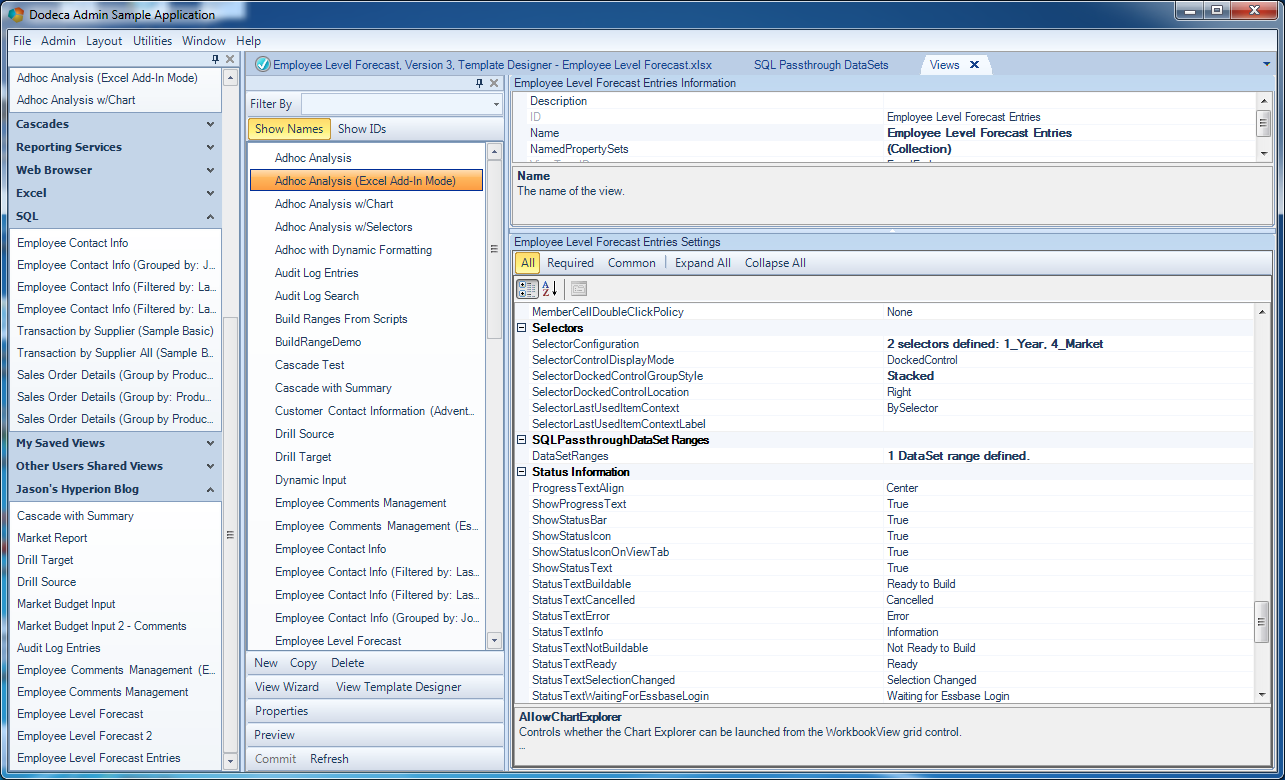
Having already defined the view template, it’s time to dial in the options for the view itself. Generally speaking, the default values for a view are pretty sensible, but it will be useful to change a few things. Consider this first section of view options:
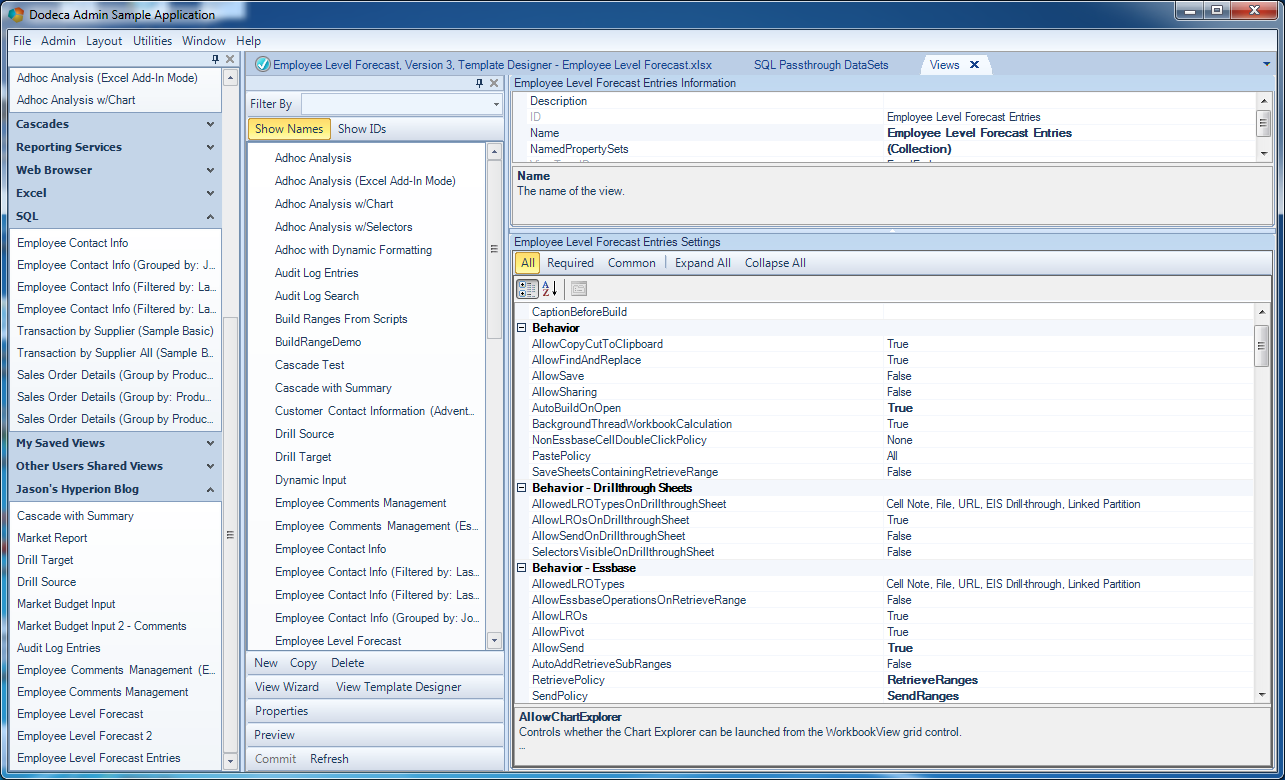
Initial view options for Employee forecast view
As with before in this series, options that are in bold are ones that do not have a default value set (this is an incredibly awesome feature by the way). As you can see, I set the AutoBuildOnOpen to True (so that, unsurprisingly enough, the view builds [if it can] when it is opened). I have enabled Essbase data sending (AllowSend = True), and configured the RetrievalPolicy and SendPolicy to RetrieveRanges and SendRanges, respectively. By default Dodeca will consider the entire sheet as the send range, but since we have multiple ranges in play, we want to tell that to Dodeca.
Scrolling down a little bit shows more view options I’ve tweaked:
Additional Employee Forecast view options
There are two selectors defined (for the Year and Market user selections). For the selector grouping I have chosen Stacked (I like this UI model in many cases since it shows more of what’s going on at once). As you’ll see in a moment, this option results in the selectors being shown on the side of the view, one on top of the other. The remaining non-default option on this screenshot is the SQLPassthroughDataSet Ranges group, showing I have a DataSet defined. The DataSet needs to be defined a little bit:
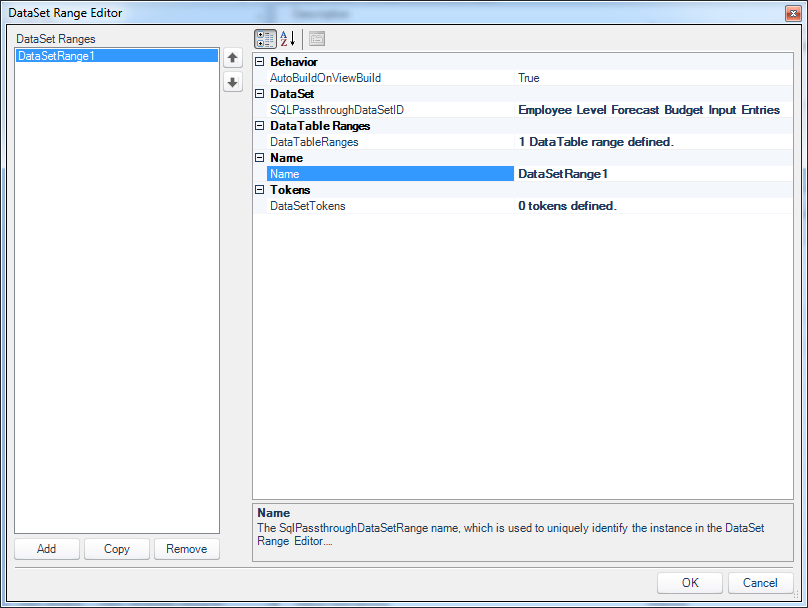
Editing the data table range on the view
There’s not a lot here except to note that there’s a single DataTable definition, which we also need to make sure is setup properly:
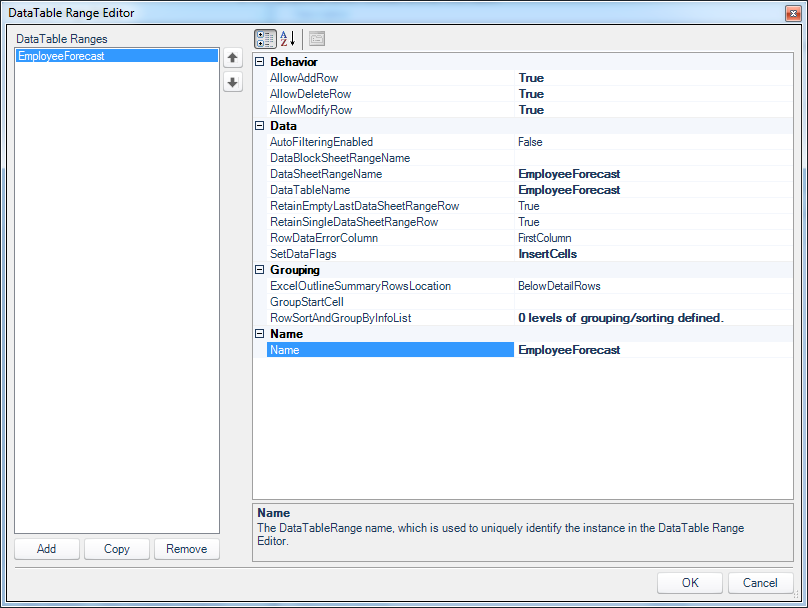
Configuring our DataTable
In this data table (think of this as a view-specific window into our SQL definition from the passthrough dataset), we explicitly tell Dodeca that yes, adding rows, deleting rows, and modifying rows is allowed (we can choose any/all/none of these to be enabled). Further, we specify the range name on the sheet that corresponds to this data, and lastly I have configured one of the SetDataFlags to include the InsertCells setting. This setting is useful in this case so that cells/rows are logically inserted to the spreadsheet as needed – thus preserving my formatting and cell references, just as if we had been in Excel and inserted a row.
Lastly on the view options are the following:
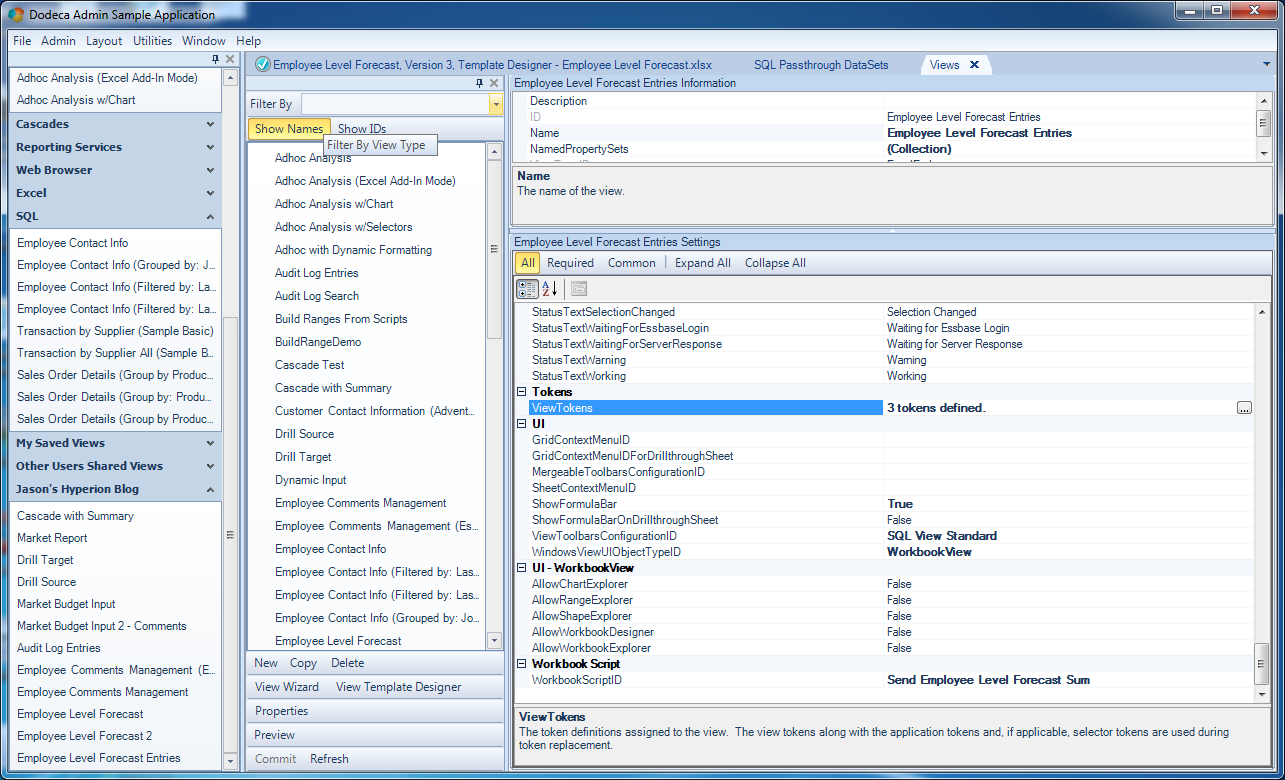
Yet more view options on the view
Here we see that I have 3 tokens defined on the view itself (only one of these is relevant to our purposes at this moment), and the formula bar is set to display (for now). Notice the ViewToolbarsConfigurationID setting. Here I’ve chosen the “SQL View Standard” item. This is a really interesting setting and it warrants a moment to explore. In Dodeca, the toolbar that that is shown for a particular view is configurable. That is, we can choose which toolbar to be shown (as a really advanced topic to be explored a future date, the toolbars themselves are completely configurable). I think this is a really, really interesting feature in Dodeca. Most tools don’t give you this level of configurability. Generally, the UI is quite fixed, and yet here can basically do what we want (of course, most of the time we’ll just choose a default toolbar such as we are doing here). And we get that flexibility without having to dig around in some custom programming or hack job scripting that will make system upgrades down the road a complete nightmare. To Dodeca, it’s just all some data and metadata (no big deal).
Workbook Scripting
The very last configuration item to note, and one what I’m going to dive into right now, is the Workbook Script setting. We can leave this setting blank (as it often will be), indicating that there is no associated workbook script (they are optional), otherwise, we choose a workbook script to be associated with this view.
I won’t go so far as to say that workbook scripts are the secret sauce, the glue, or the magic in Dodeca views. I mean, they are all of these things, to some extent, but there’s another way to look at them. Think of the spreadsheet view paradigm as being declarative. It’s descriptive: you lay out the grid, you tell configure some options and settings, and let the tool (Dodeca) figure out what to do with it. Then you have workbook scripts. For those times when being declarative isn’t enough, workbook scripts add all of the procedural functionality you need to do things. Workbook scripts provide functionality that executes in accordance with a event-based model. For example, there are many events associated with the view lifecycle: opening the view, the user selecting tokens, the user requesting to build the view, the view being built, the user submitting data, and more. There are many, many events in the view lifecycle and we can ‘hook’ into them simply by selecting it from a list and pointing it to some section of methods in our same workbook script.
So, let’s open up the workbook script that I have already created and take a look at it. Nicely enough, we can simply right click on the WorkbookScriptID cell on the view options screen and select Edit Workbook Script (how convenient!). You can see that the workbook script editor has four main panels:
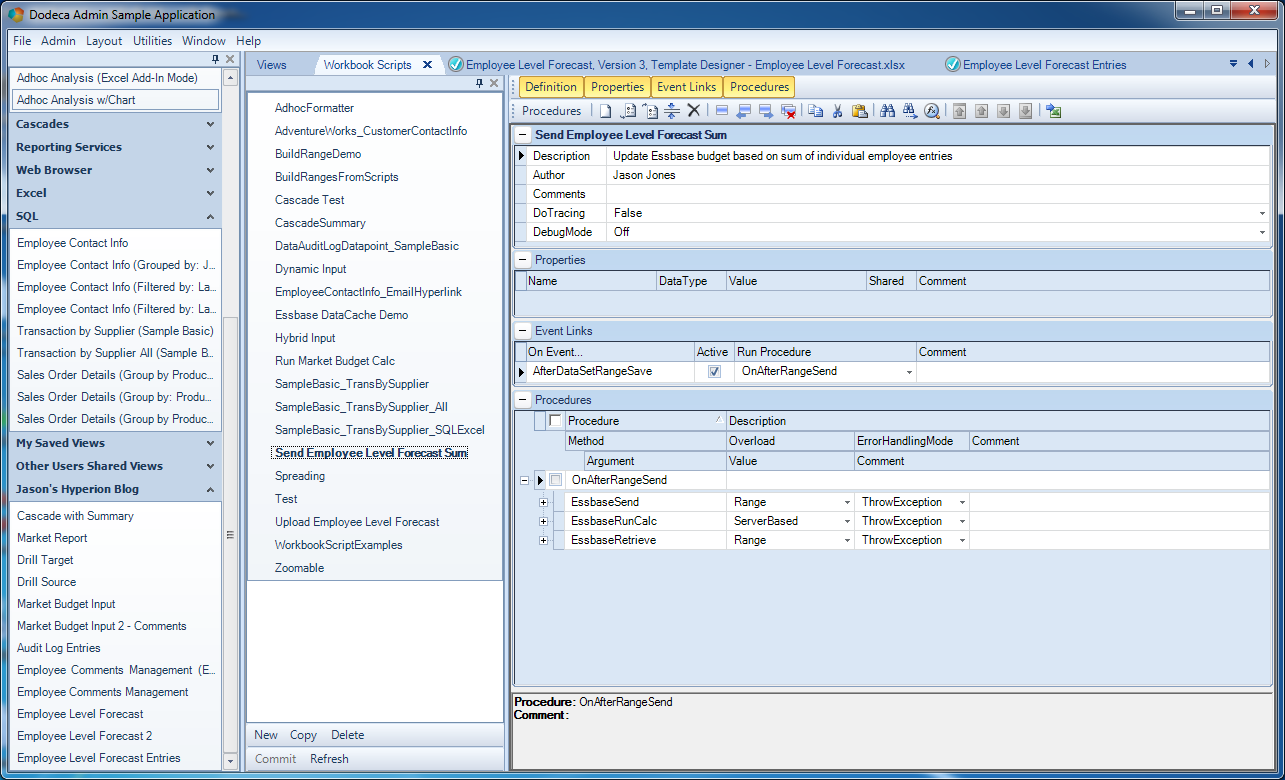
Employee forecast input workbook script
The four panels are basic information about the entire script, a list of optional properties, event links, and procedures. There’s not much to see in the basic properties right now: just a description of the workbook script that I provided, the author name, and some default values. Next, in the Properties panel, you can see that I don’t have any properties defined, so we don’t need to worry about that for now.
Over in the Event Links panel is where things start to get interesting. I just mentioned that there are numerous events in the view lifecycle and that we can attach a procedure such that it executes at the proper part of the lifecycle. There are times that we need to hook in to things at different steps so that we can modify data on the grid, add a property, or otherwise perform some action that will affect the rest of the actions that occur between the user selecting values and the user seeing what they want to see.
Recall the original stated goal of this view: we want to input relational data and when the user submits the data to be saved in the relational database, we’d like to take that data, sum it up, send it to the cube, then refresh the view of data from the cube for that intersection. So one of the events we can hook into is the AfterDataSetRangeSave event, meaning that after the relational dataset is saved, we want Dodeca to fire off our custom procedure.
As for that procedure itself, that brings us to the fourth panel in this editor. Look at how the name of the procedure to run (OnAfterRangeSend) corresponds to the name of the procedure below. Below this procedure name and indented are three rows. These are the individual methods of the procedure. They’ll run in succession when the procedure is executed. Let’s take a look at the details of these three steps:
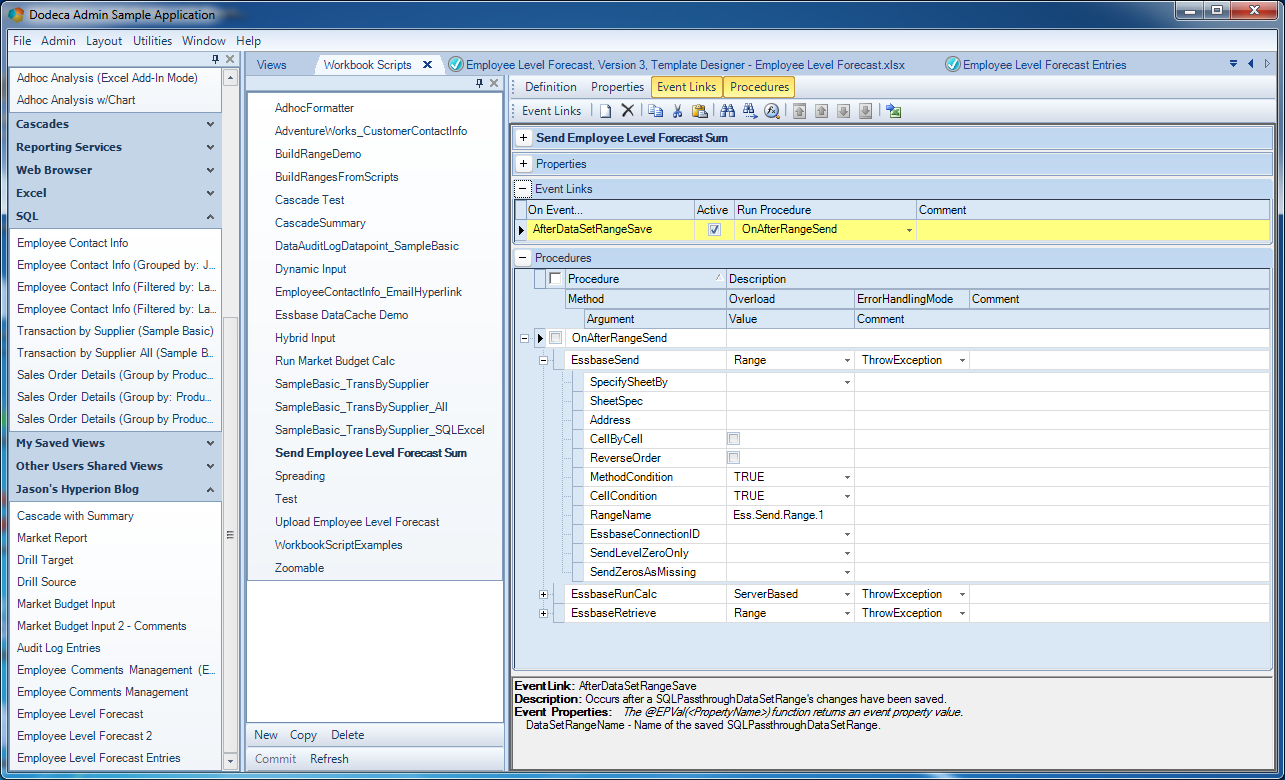
Workbook script, step 1
The first step is that we want to send a range of data up to an Essbase cube. All of the rows for this step are shown. Most of them are default values, though, so while it may look like a lot of configuration, it’s really not. In fact, the only thing at all that had to be changed on this method was to fill in the RangeName parameter with a value of Ess.Send.Range.1. The rest of the options are defaults. Now, think back to this corresponding send range that we configured in the template (the hidden one). Even though it’s totally visibly hidden from the user, it still exists, still has data, and can still be used to upload to Essbase. Further, the POV for this range references tokens from the user selectors, and the singular data cell on the range (the cell to be written back to Essbase), is simply a cell reference that points to the cell containing the sum of the data in the SQL data table. So there’s nothing we have to do to this range to prep it before sending it up to the server.
In other words, think of this as a completed automated sequence that is equivalent to us using the Excel add-in to punch a data value into a grid, select the grid, connect to Essbase, then lock it and send it (or perform a Submit Data).
While we’re on this procedure, look at the EssbaseConnectionID setting below the RangeName setting. It’s blank. Again, wherever possible, Dodeca tries to provide sensible defaults or Do The Right Thing. In this case, with no provided Essbase connection, it simply uses the Essbase connection already present on the grid. So we don’t need to specify it. But interestingly enough, we could. And more interesting – it doesn’t even have to be the same Essbase connection that the sheet uses. That’s right, if we were so inclined, we could just retrieve data on the sheet from one (or more) cube, then send the entered data back to a completely separate cube.
The next step in this sequence, to be run after we’ve uploaded the proper data to the cube, is to run a calc to roll it up:
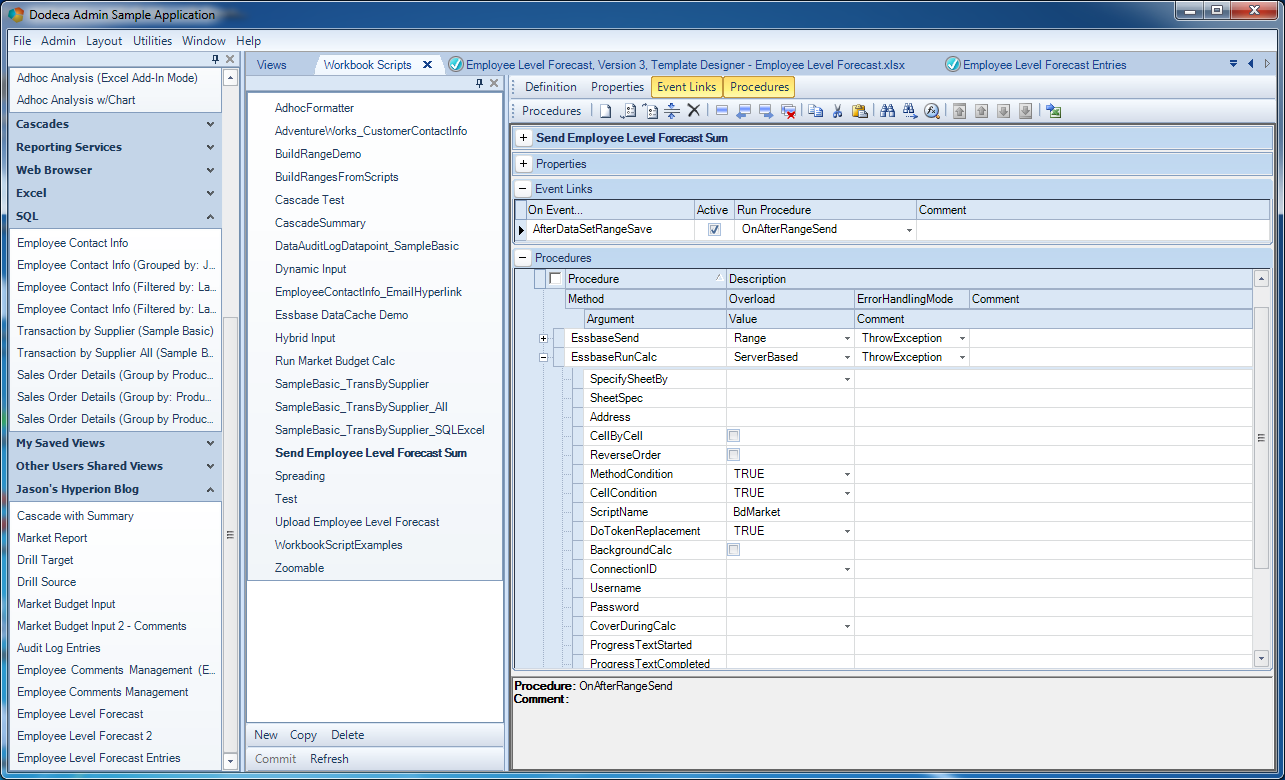
Second method in our Employee forecast workbook script
This is accomplished with the EssbaseRunCalc method type. Further, this is the ServerBased version of the method (meaning to run a calc located on the server/cube). Again, defaults are mostly fine here, but I have set two things: the ScriptName and the DoTokenReplacement set to TRUE. Needing the script name should be obvious. Not so obvious is the token replacement. Inside of the script are normal Dodeca tokens, as shown here:
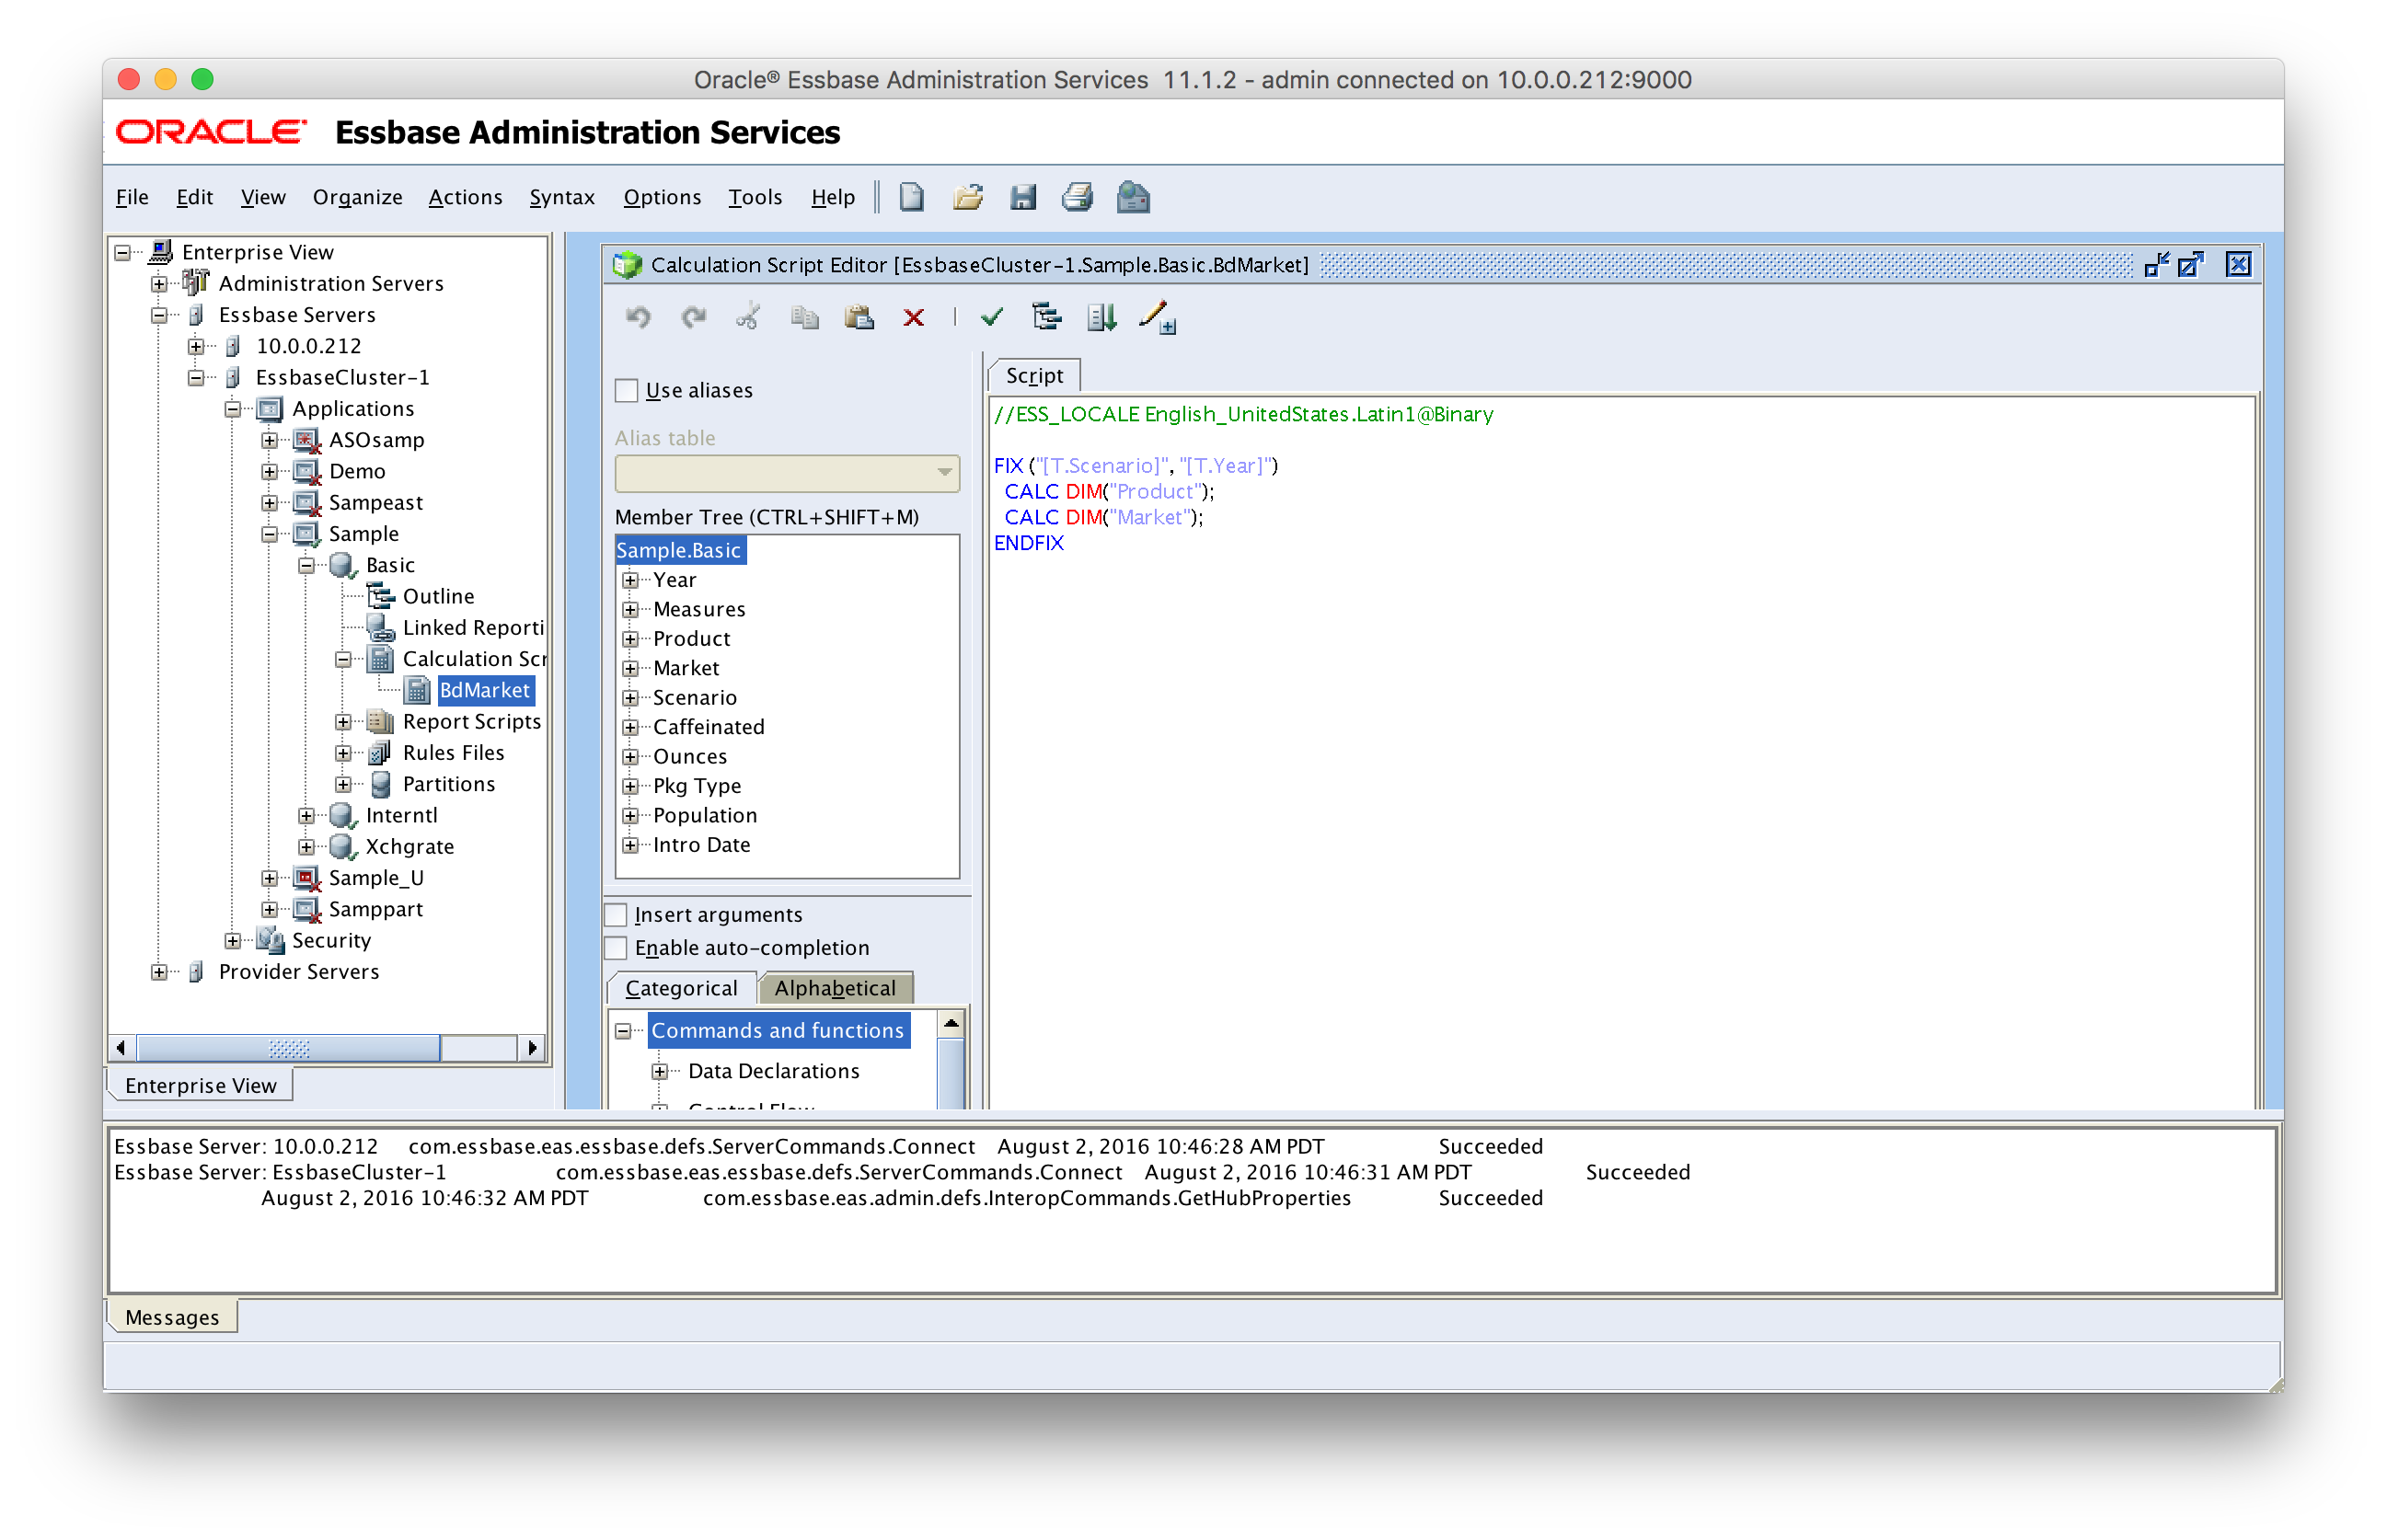
Tokenized calc script
You can see that I used the [T.Scenario] view token and the [T.Year] selector token in the FIX statement. This lets me narrow the range of the calc. As it relates to Sample/Basic, the script will be fixing on the Budget scenario only, and then on the proper time period. I don’t need to worry about aggregating these because Budget doesn’t roll up to anything, and all of the ancestors of the period (e.g. Qtr1 and Year) are dynamic calcs. The parents of the measure I am loading to (Sales) are also dynamic calc. This means I just need to roll up Product and Market, which you can see inside of the FIX.
The last step in the workbook script sequence is to refresh the newly calculated data into the retrieval range. This is handled easily enough with an EssbaseRetrieve method:

Third step in employee input forecast workbook script
As with before, I am mostly happy with the defaults, and simply filling in the RangeName value to point to my retrieval range of Ess.Retrieve.Range.1 (using the standard Dodeca nomenclature).
From a functional perspective, the view is pretty much good to go. For completeness, I want to cruise over to my SQL tool of choice and take a quick look at the definition of the table that is used to store the forecast/budget entries for the data range:
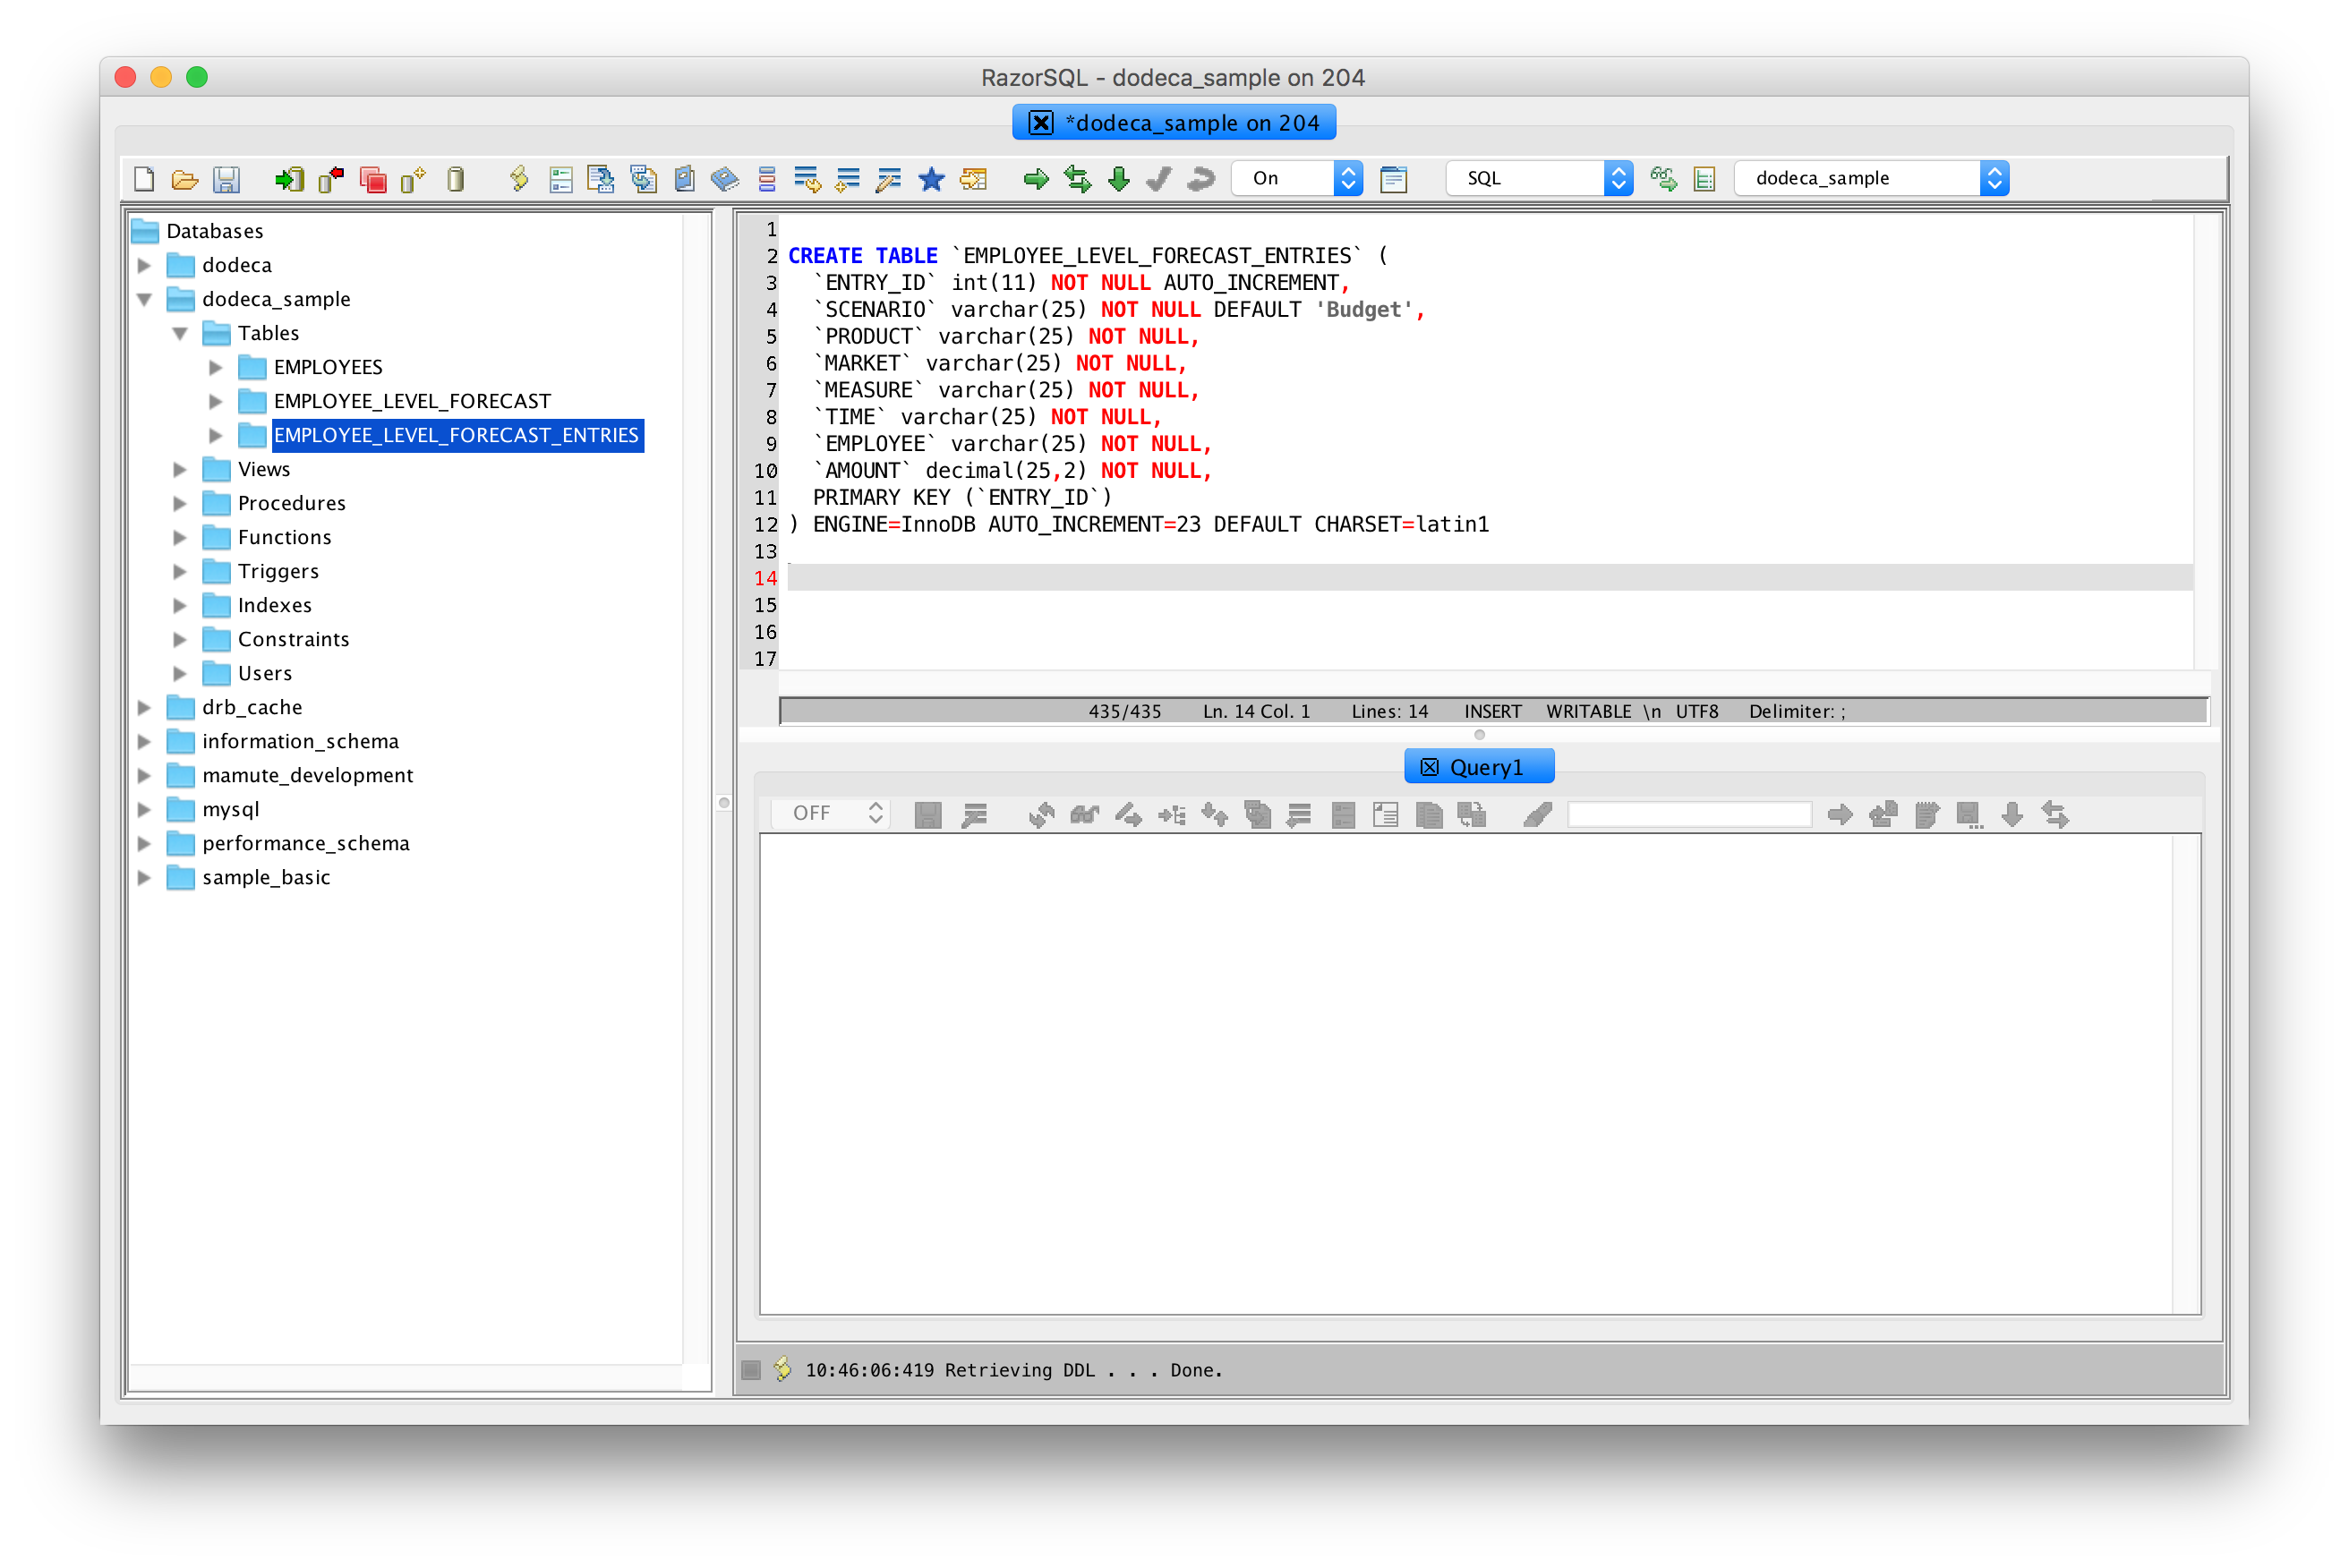
SQL table definition for employee forecast entries
And here is some of the sample data in this table:
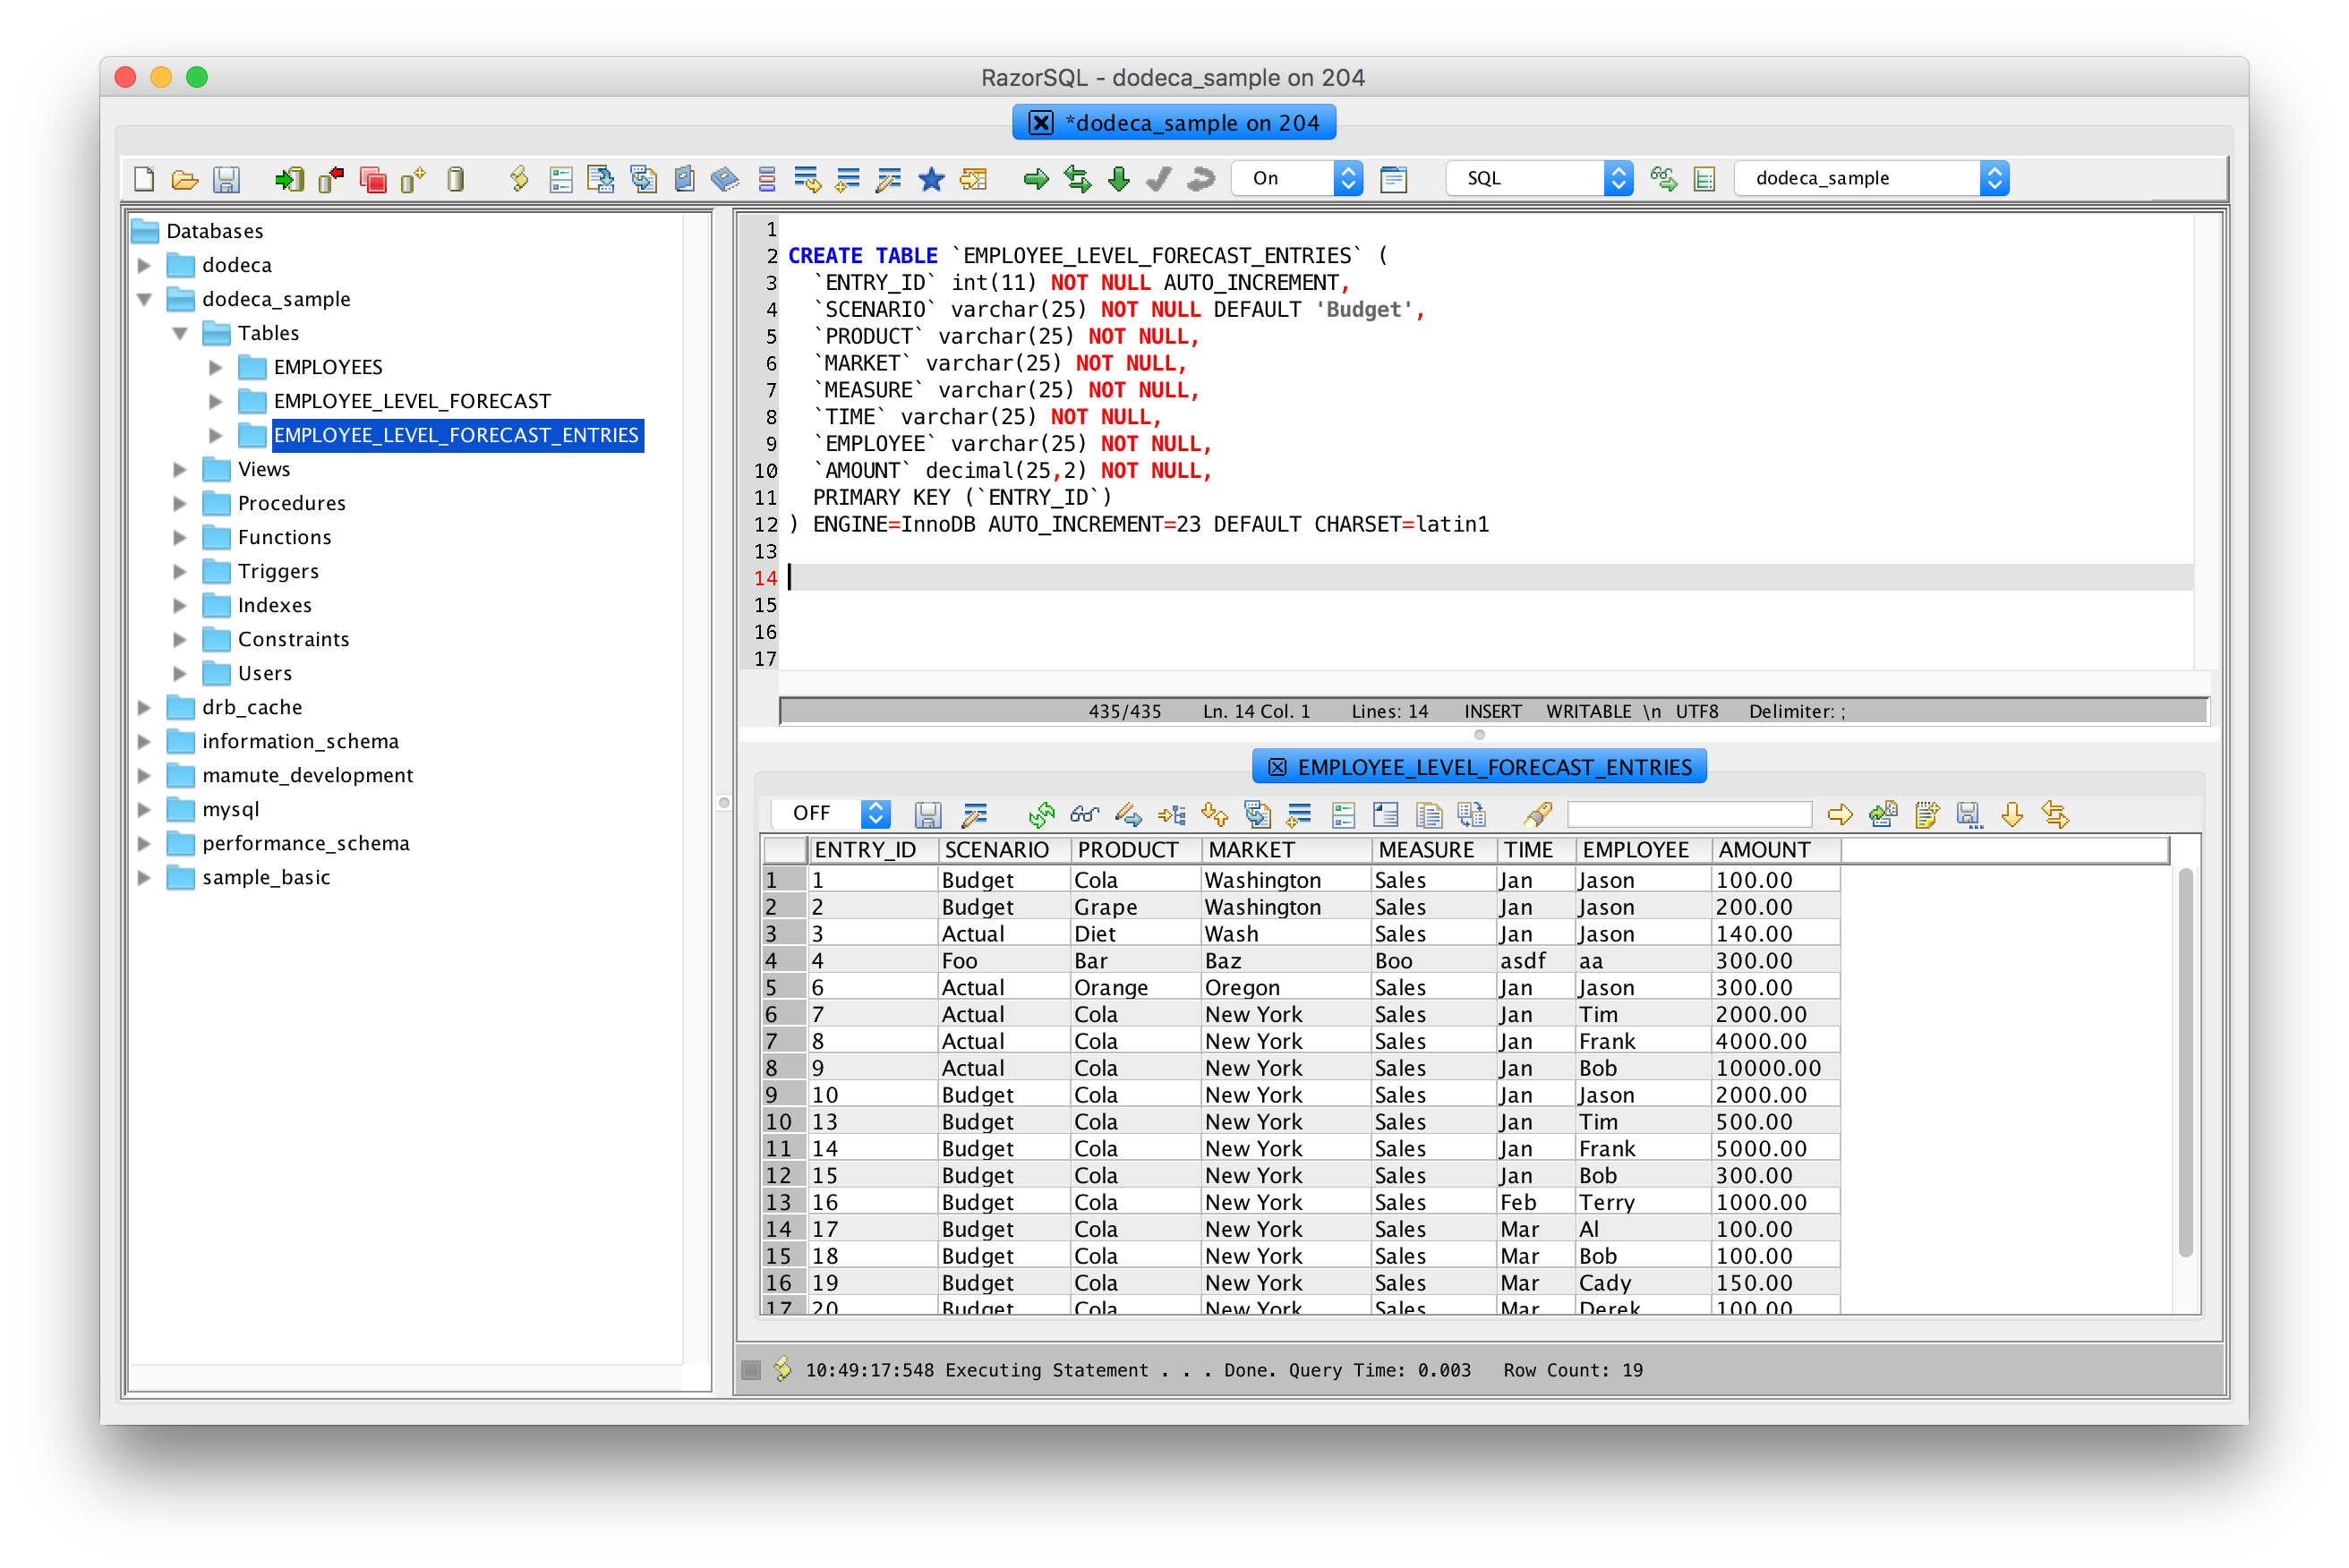
Employee forecast sample data
We still have some cleanup to do with respect to the view formatting, but let’s go build the view to see how things are looking:
The configured hybrid input view, built
I want to point out something interesting that I configured as well. In this input situation, it doesn’t make sense (in fact, it’s be bad) for the user to budget to an upper level time member, such as Qtr1. I actually configured the selector so that the maximum level for an entry is 0 (a leaf node, or a node with no children, which in this case is the specific months of the year). Look what happens now when I try and select Qtr1:

Selector max level in effect
I can select Qtr1, but as soon as I do so, the build option is disabled (what is normally a green arrow icon just above the grid is now a greyed out, disabled icon). This was accomplished over in the selector configuration. Actually, I wound up making a selector for just this purpose, in case I want to reuse it across some other views:
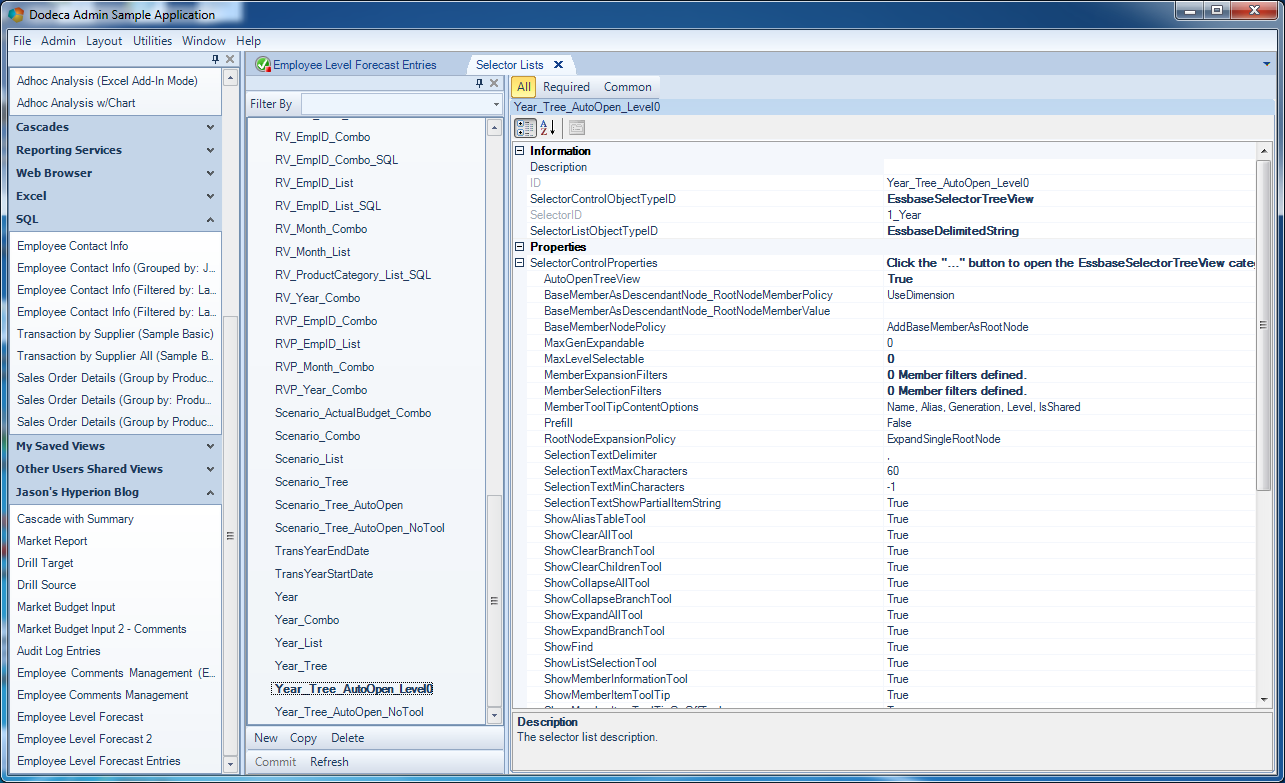
Selector max level configuration
In particular, notice the MaxLevelSelectable value set to 0. If you think about it, the process of selecting a member or members has quite a few nuances to it. We might need a high degree of control as to what the user sees, what they can select, and more. We have the power to be very particular about how selections are made.
The Big Picture
With the SQL dataset, view, workbook script, and selectors are configured, I want to zoom out for a moment and paint a picture/flow of what we’re doing in this view. Consider the following diagram:
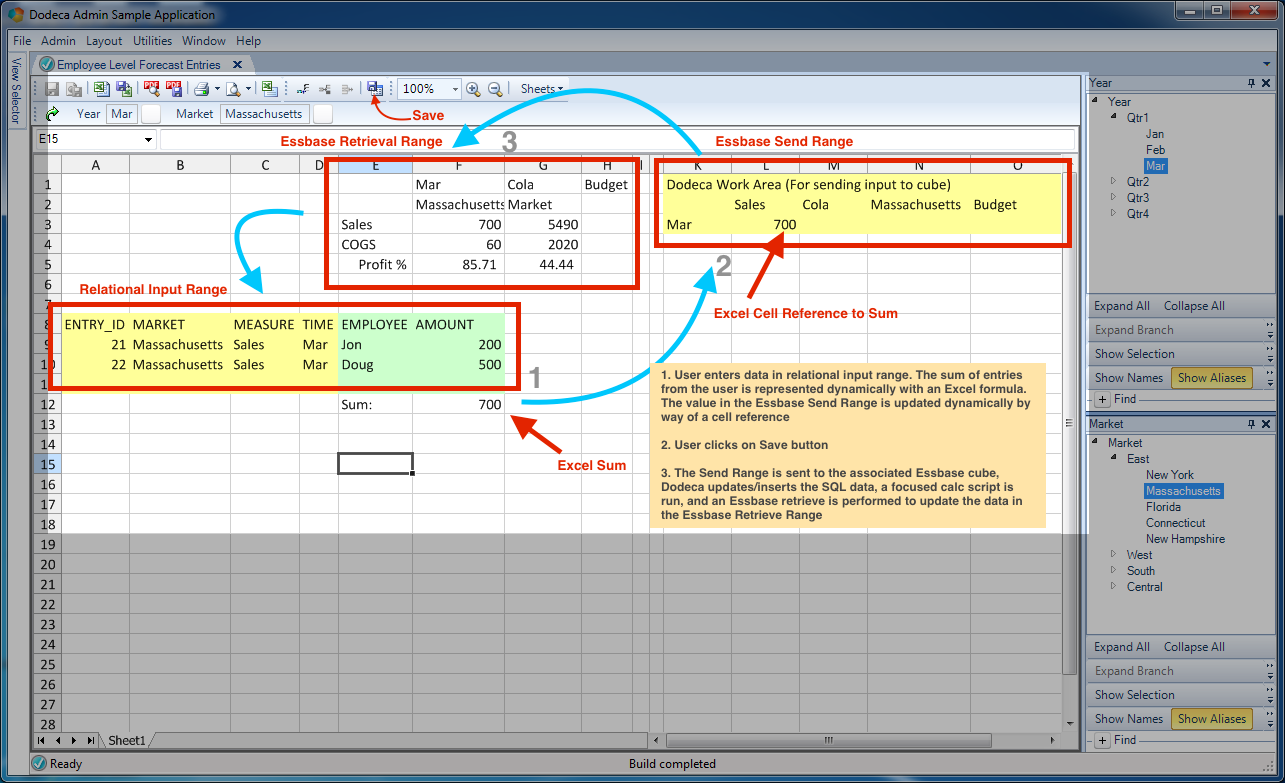
A graphical overview of the dataflow/mechanics of the view
Step 1 is that we (the user) will be adding/editing/deleting rows in the range of data that has been designated as such. Upon entering the data we are satisfied with, we can save it, using the Save icon on the toolbar (not the disk icon, mind you, but the SQL data save button). Upon doing so, Dodeca sends the data up to the relational database. Next, the sum of the entries we have edited or otherwise already exist will have been dynamically updated into a send range (i.e., the value in cell F12 automatically shows up in cell L3 because it’s a simple Excel formula of =F12). Upon saving the data to the relational data (according to the definition of the SQL Passthrough DataSet), Dodeca kicks off the corresponding workbook script procedure that we setup and associated with the view. The workbook script procedure runs three steps: one to send a range of data up (shown in the above diagram but will be hidden to when we clean up the formatting a bit), the second step to run a tokenized calc script that resides in the cube and aggregates up the higher-level data, then the third step that runs after the calc finishes, and that is to update our Essbase retrieve range. In the Essbase retrieve range, we expect that the value for the current market we’re editing should match up with the sum of values from the relational table.
You might also notice that the retrieve range contains COGS in addition to Sales, as well as a Profit %. Our expectation is that when we edit sales (such as to increase them), that our Profit % (by virtual of being a dynamic calc in the Essbase cube) will go up as well – more so for the specific region, and less so for the sum of all of the regions.
I might call this a “bread and butter” Dodeca template as it employs a fairly common pattern in the Dodeca world: take some data, do some “magic” off to the side, then show the results.
Cleaning Up
With all of the major plumbing looking good to go, we can now turn our attention to “prettying” things up a bit. For starters, we can hide the columns with the Essbase send range:
Cleaning up the template
We can also hide those additional columns on the relational data table area, revealing the two things we care about (as a user) – the employee and the sales amount (and not the redundant scenario/market/time period info):

Cleaning up the view template
Lastly, let’s insert some spacer rows/columns, format some numbers, throw in some shading/borders, hide the Essbase POV little bit (in favor of some dynamic formulas below the header) to really spruce the place up a bit:
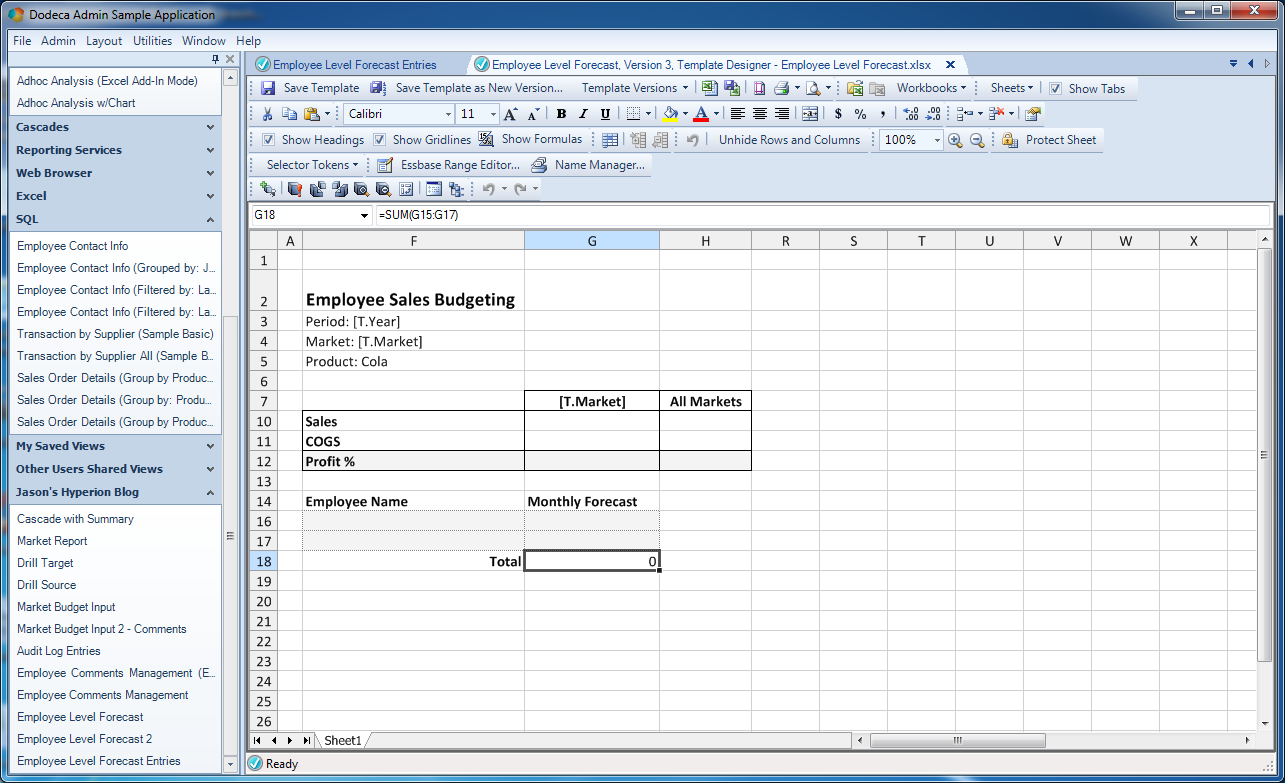
The cleaned up view template
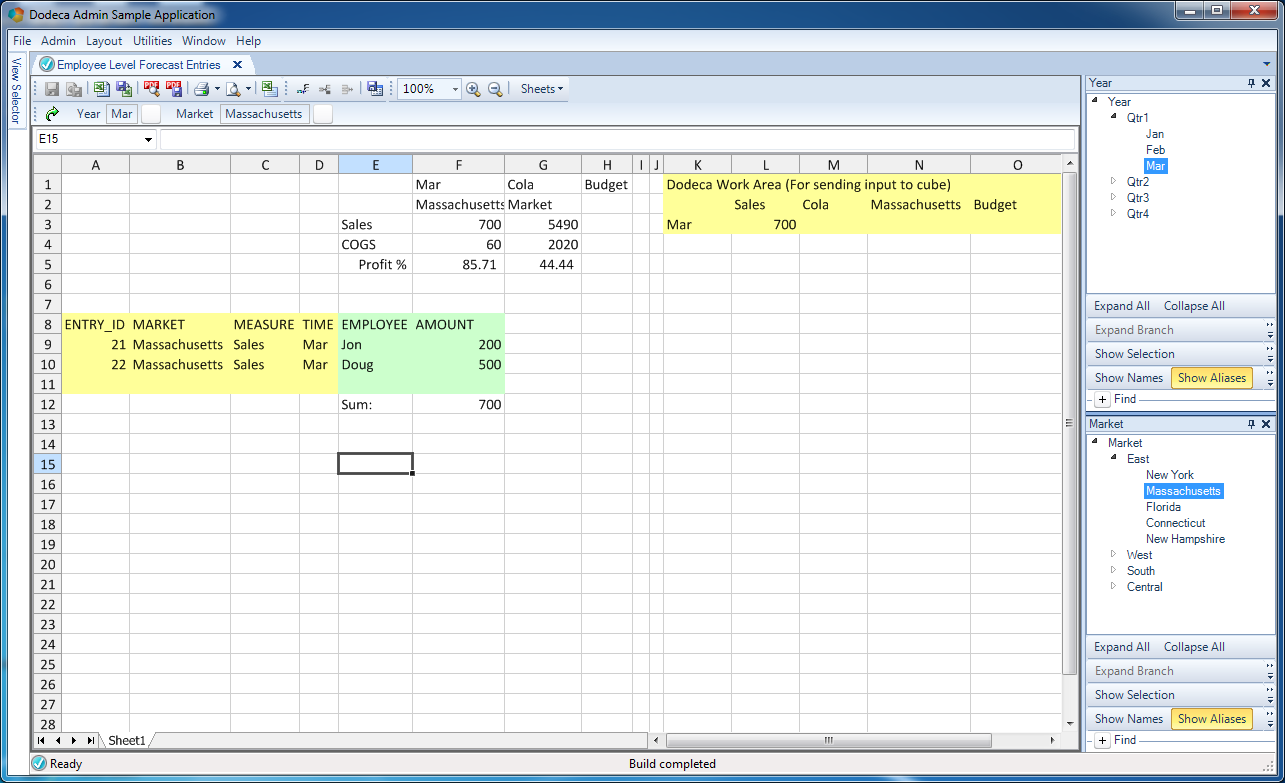
As some additional UI tweaks, I went ahead and turned off the display of tab names at the bottom of the sheet, turned of row and column headers (the grey column/row name boxes), and turned off grid lines. Now when we go build the view, we are presented with a nice clean look:
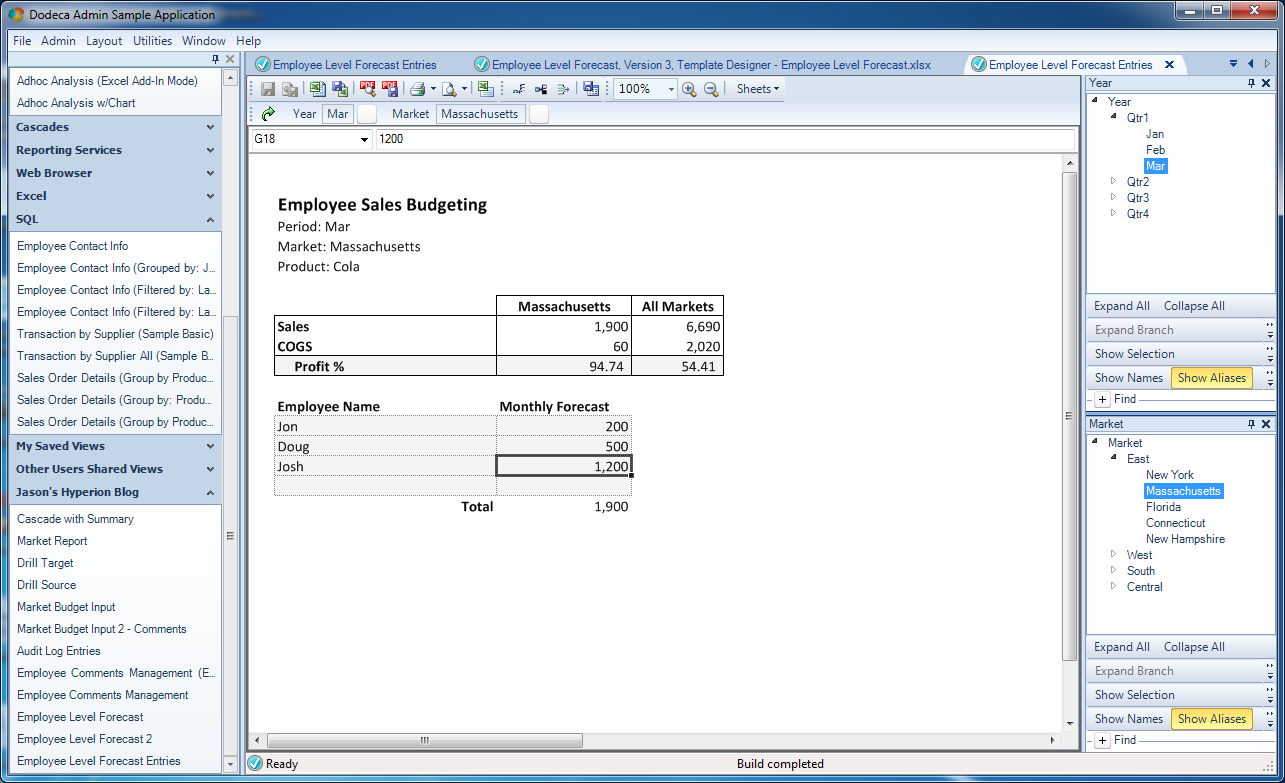
Built view with formatted template
Looking good!
Summary
This was a very long (but hopefully helpful) article. If you only learn one thing from this, let it be the realization that the central spreadsheet paradigm in Dodeca is incredibly flexible, and accommodates an entirely diverse number of requirements. We were able to combine the elements from the previous articles – Essbase data input, SQL data input, focused calcs, and workbook scripts – and tie it all together cohesively in a single, easy to use view. Further, we were able to do it in a way that was built around what we wanted the user experience to be, rather than having to make sacrifices in the user experience due to rigidity in the tool. Mixed together with a little formatting, workbook scripting, and other small tweaks, we were able to build a process that doesn’t allow the user to shoot themselves in the foot, is light years ahead of old school lock and sends, and in this case, we basically implemented our own little Budget Hybrid Analysis using resources we already had. Or as I like to say, Dodeca gives us structure, with flexibility.