I’m gonna go a little crazy today and combine two worlds, just for fun: the Vess “virtual” Essbase JDBC driver, and of course, Dodeca. I’ve written about Vess before, and even talked about it for a bit during Kscope16 earlier this year during a presentation with Tim Tow and Harry Gates on various interesting things we’re doing with Java and the Essbase Java API.
As a quick crash course on Vess, it’s a highly experimental Java JDBC driver that models an Essbase server’s applcations/cubes/properties into variable relational tables (I’ve written about Vess a few times before). At the moment this includes cube outline data, cube data, substitution variables, miscellaneous properties, and more. For example, when you connect Vess to, say, Sample/Basic, one of the tables you’ll get is SAMPLE.BASIC_VARS and it’ll contain four columns: the application, cube, variable name, and variable value. You might think you wouldn’t need to know the application and cube for this table but due to a nuance with Essbase variables (you can have the same variable name at both the cube, application, and server level) it’s actually needed.
In any case, not only you can read values using any SQL you want from these columns, but you can perform operations on the table that in turn affect the Essbase server. So you can do an UPDATE or DELETE and it’ll change the variable’s value, or delete a variable.
With that in mind, I thought to myself, you know what might be interesting – What if we added a Vess driver to Dodeca (since Dodeca supports third-party database drivers) and wire up a simple view that can edit the variables? So that’s exactly what I did and I thought it’d be fun to share.
Adding Vess to Dodeca
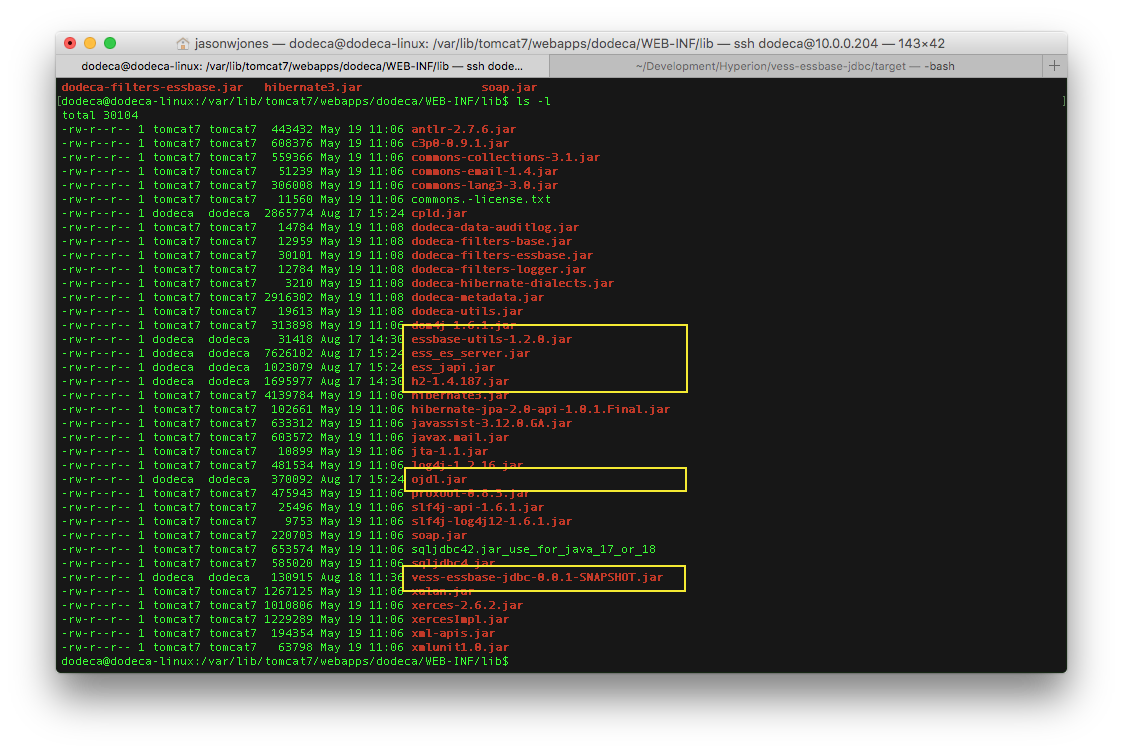
The first thing to do is add the Vess library and a couple of other Java libraries that it leans on to the Dodeca servlet. Typically you’d want to add these to your Dodeca WAR file when you build it with the “Click Once Prep Utility”, but since this is just for testing purposes, I can just add the JAR files to the already deployed servlet. I wouldn’t want to do it this way in production because when I went to deploy a new WAR file, I’d lose my Vess drivers. Here’s the drivers added to the /dodeca servlet:

Vess Java JAR files added to Dodeca (dodeca) servlet
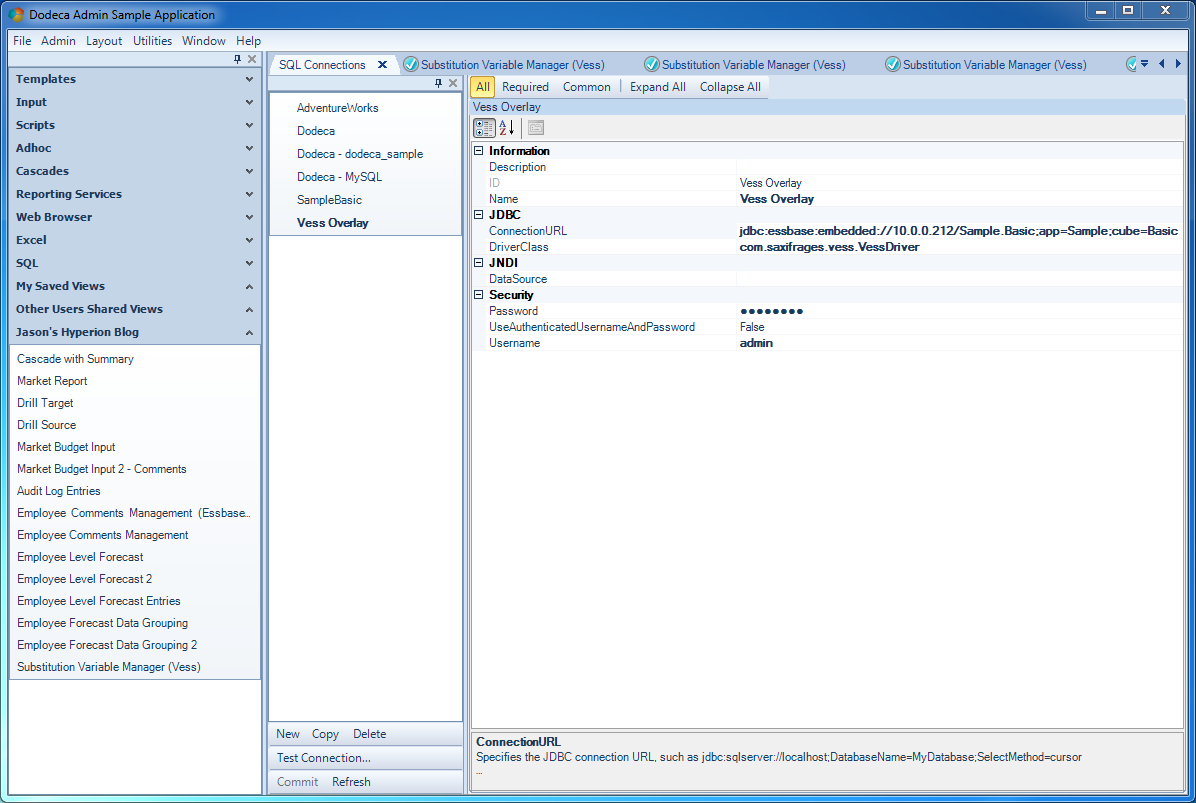
For good measure I restarted the servlet container (in this case, restarting Tomcat 7 using sudo service tomcat7 restart on this little Ubuntu VM). Then we can login to Dodeca and create a new SQL connection:

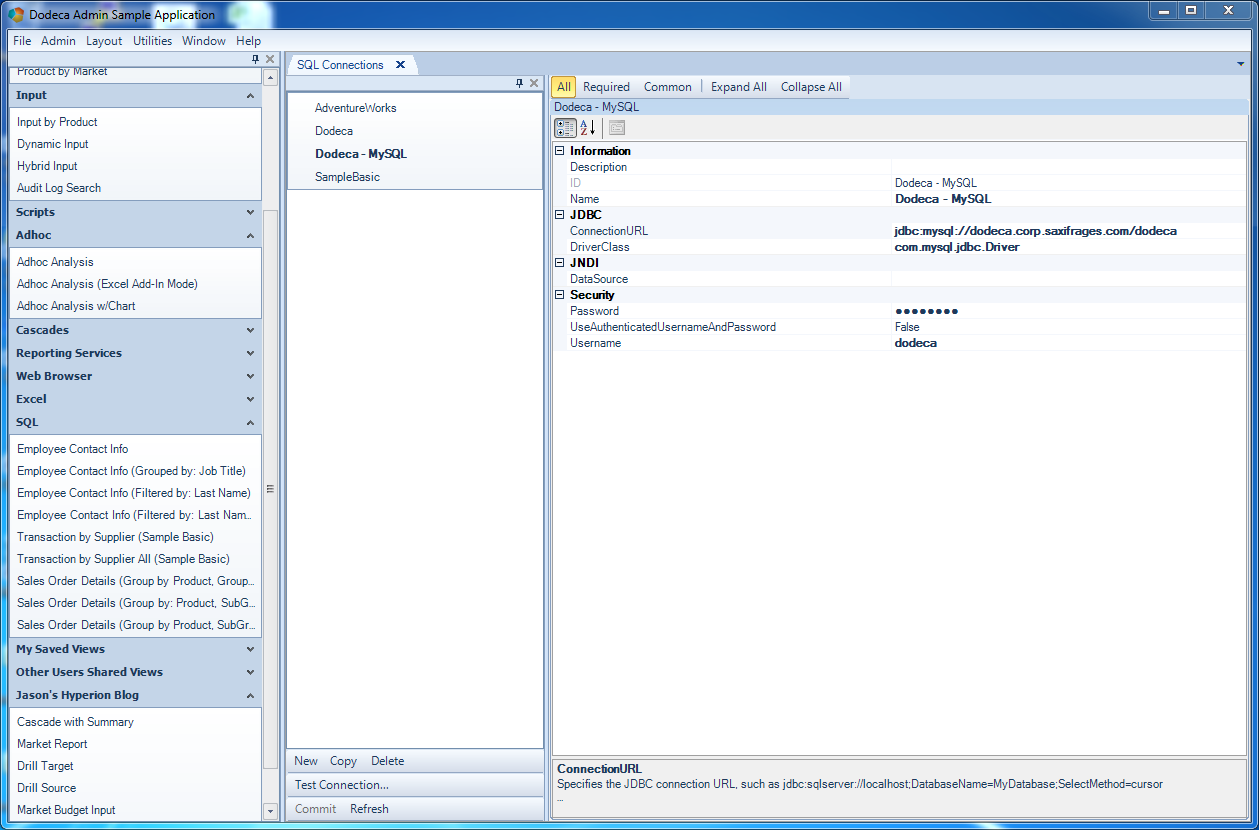
A Vess connection is created inside of Dodeca
There’s not a lot to see here other than to “show off” that Vess is indeed just a normal JDBC driver as far as other software is concerned – in this case, Dodeca. As you can see, Vess introduces a JDBC URL format. Vess can connect in embedded mode (in this case, indicated in the scheme of the URL. The rest is fairly standard: the address of the server (Vess assumes the default port of 1423 if none is specified), and in this case, a particular app/cube to connect to. Other than the URL, the driver class is specified. As with Oracle/SQL Server/MySQL, the class is just the Java class implementing the Driver Java interface. These typically are thing like com.mysql.Driver or something similar, and Vess is no different in this regard. Lastly for purposes of the Dodeca connection, a username and password are specified. This should be the credentials for an Essbase user, since internally Vess will use them to connect.
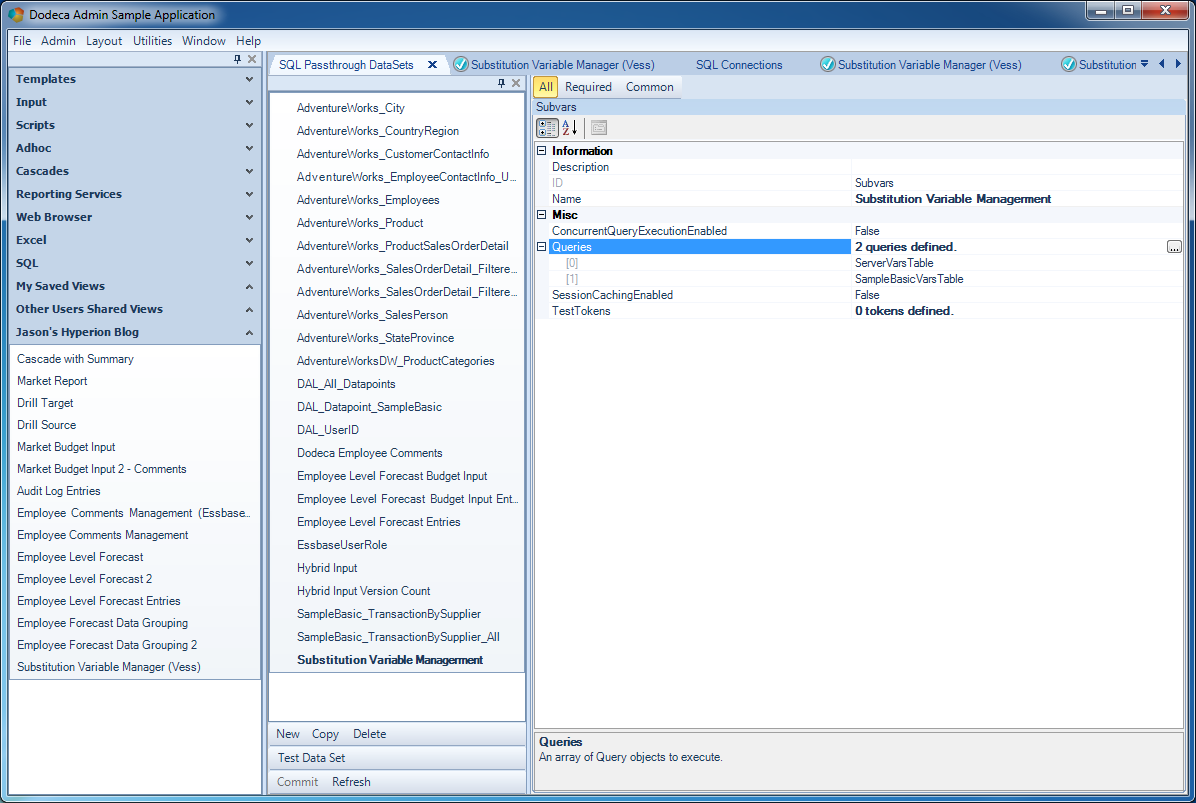
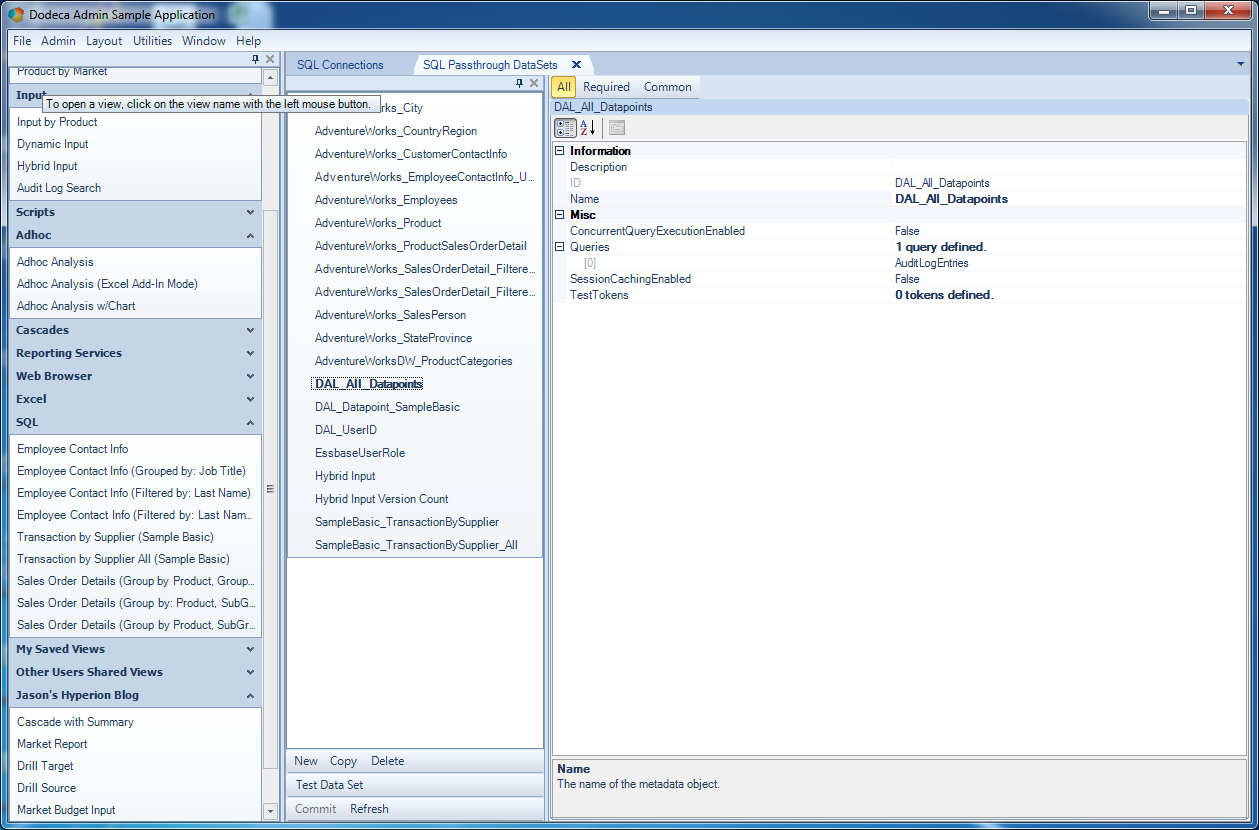
With the SQL connection mapped in, I can create the SQL Passthrough DataSet that will contain my SELECT queries, and optionally, parameterized INSERT/UPDATE/DELETE statements if I want to have support for those (which I will).

Configuring the SQL Passthrough DataSet for Vess variables
You can see that unlike some of the other SQL Passthrough DataSet examples I have shown lately, this one has two queries. It’s worth noting, briefly, that a SQLPTDS isn’t an object that just contains one query or otherwise concerns itself with one dataset. It can contain an arbitrary number of [usually related] queries. In this case I have two: one for server wide substitution variables, and one for variables just applicable to Sample/Basic (these actually overlap a bit as I’ll show in a bit).
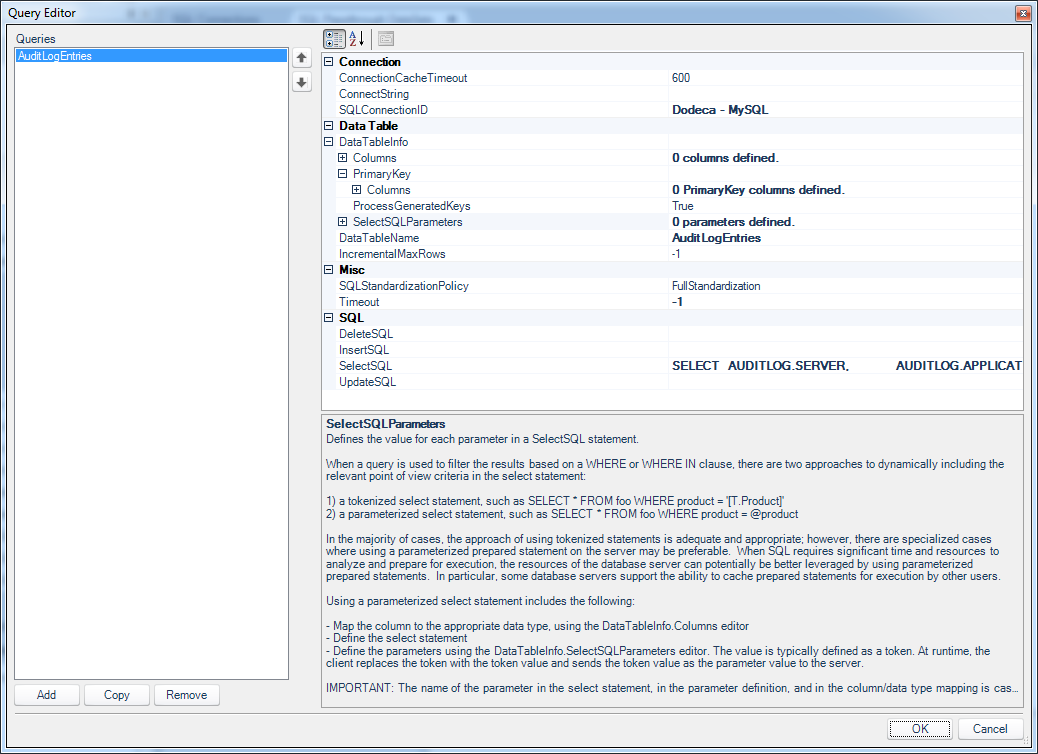
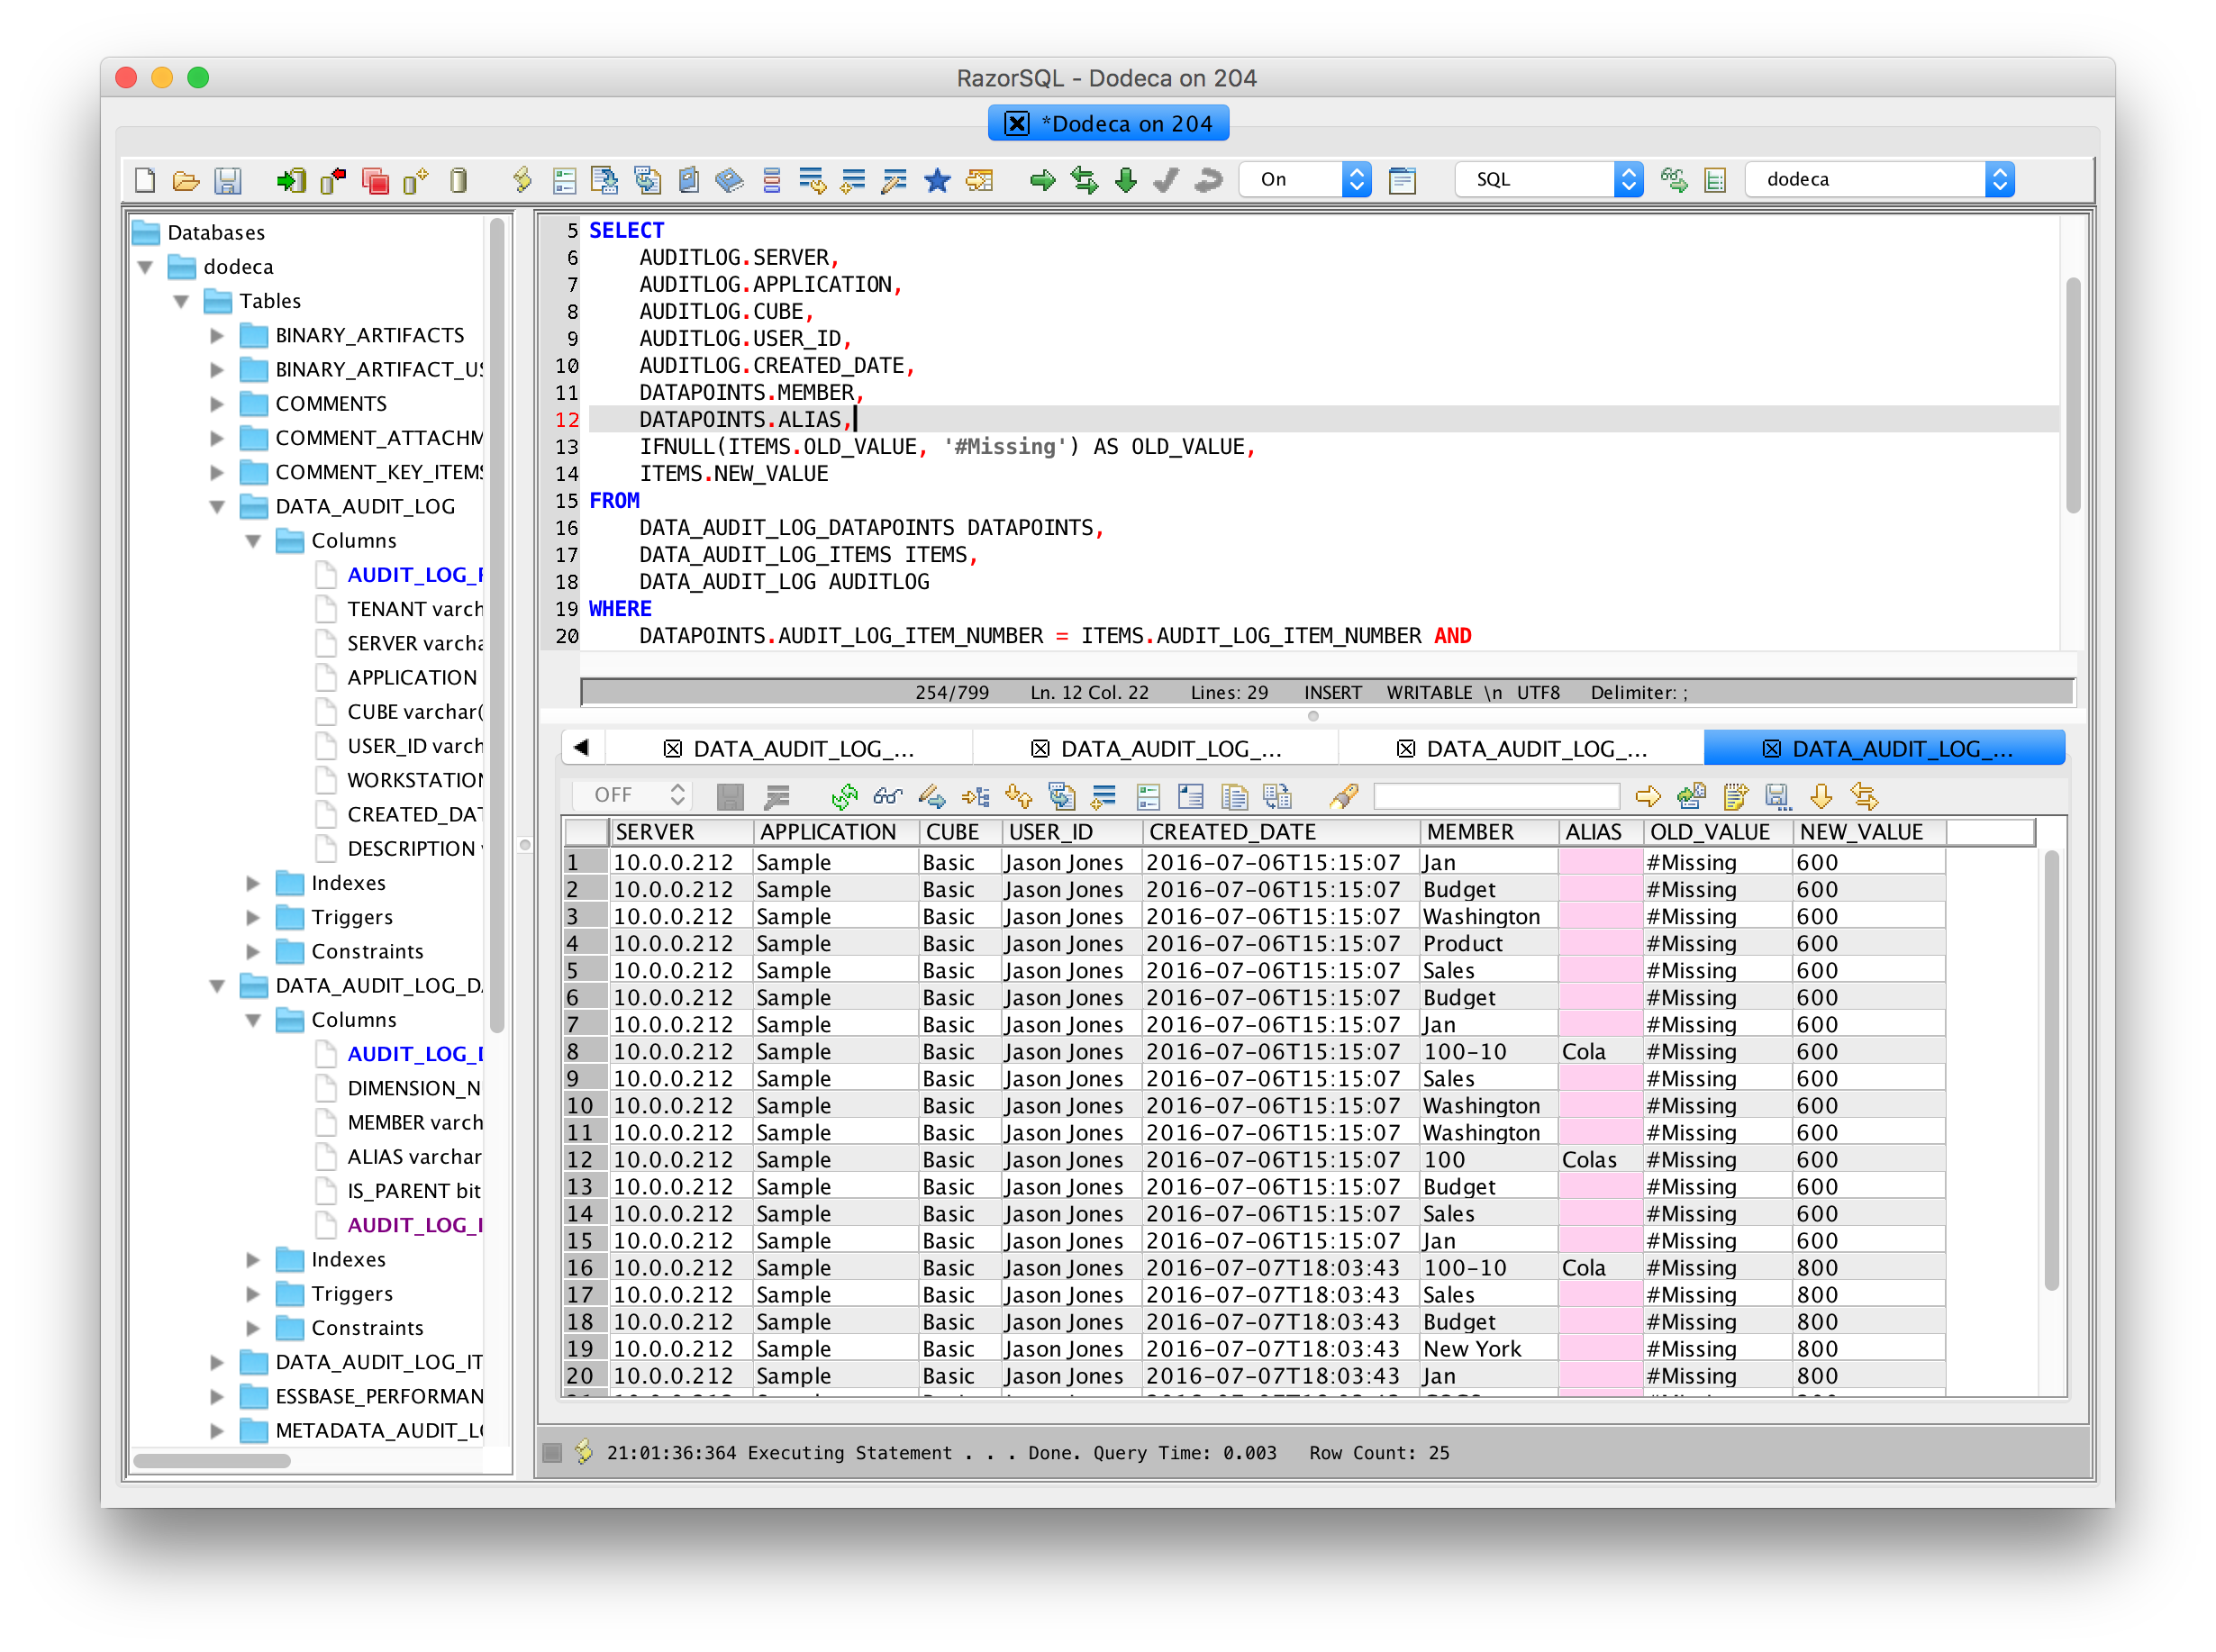
The definition for the “server variables” query is very straightforward and only contains a SelectSQL configuration:
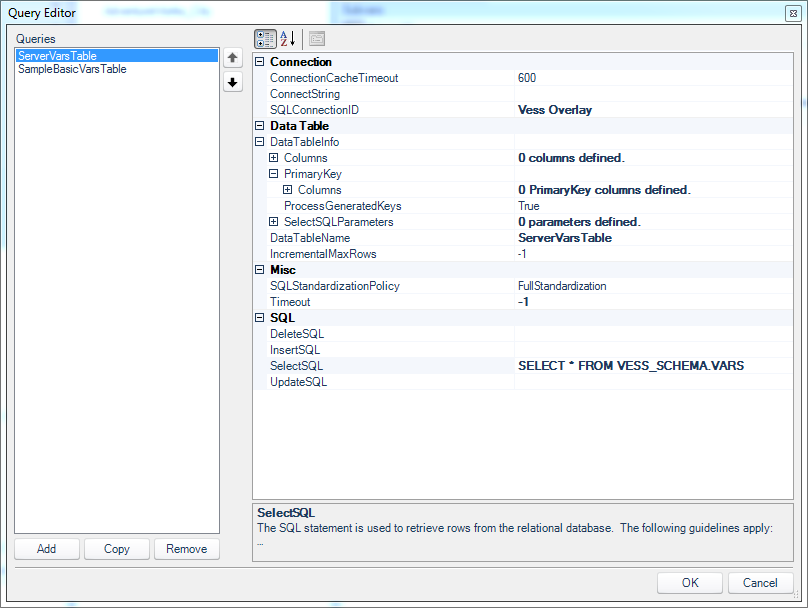
On the Dodeca query editor, looking at the first query for pulling out global variables from the Essbase server
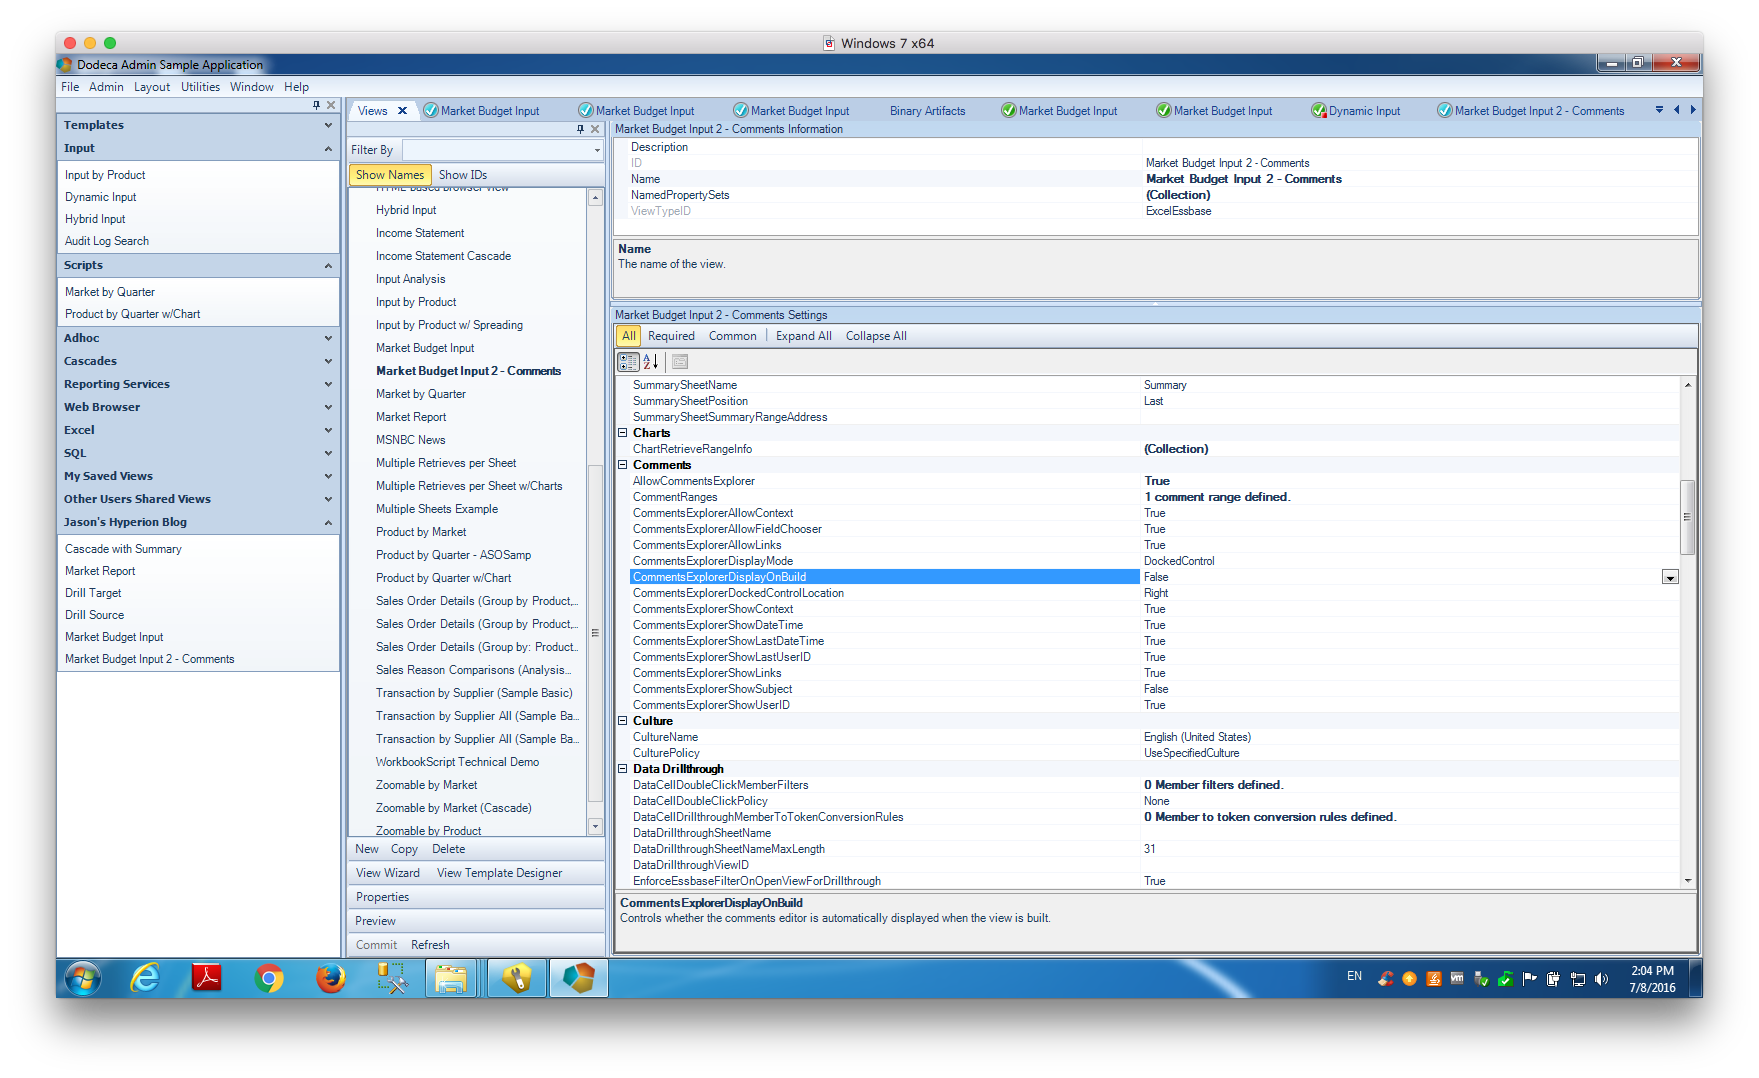
As noted earlier, Vess creates a table in the schema VESS_SCHEMA called VARS that contains the names and values of server-wide substitution variables. Over on the Sample/Basic variables configuration, there’s a little more to it:
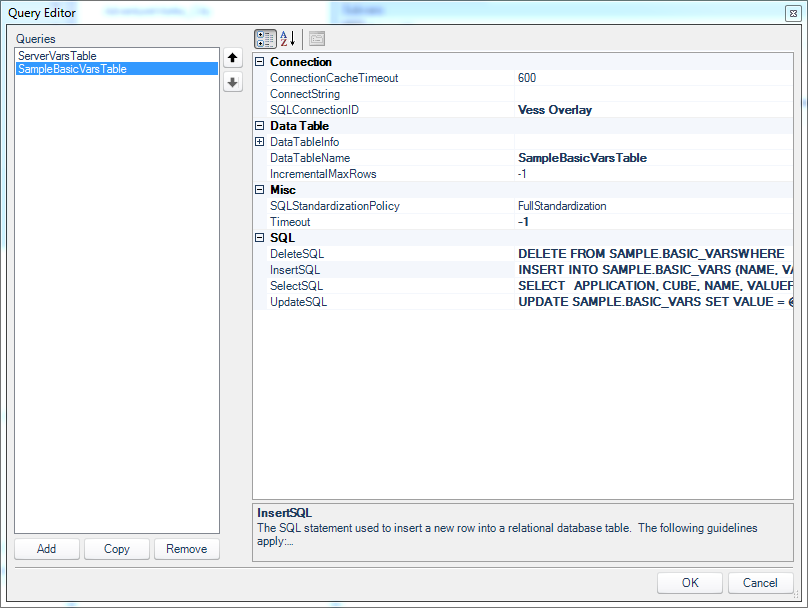
The second query is modeled on a specific table for the Sample/Basic database
Here there are queries that model the DELETE, INSERT, UPDATE, and of course SELECT operations. Not pictured (it’s collapsed on the config screen) is that I defined the primary key for this table as the combination of APPLICATION, CUBE, and NAME columns (while the final column, VALUE, is not part of the primary key).
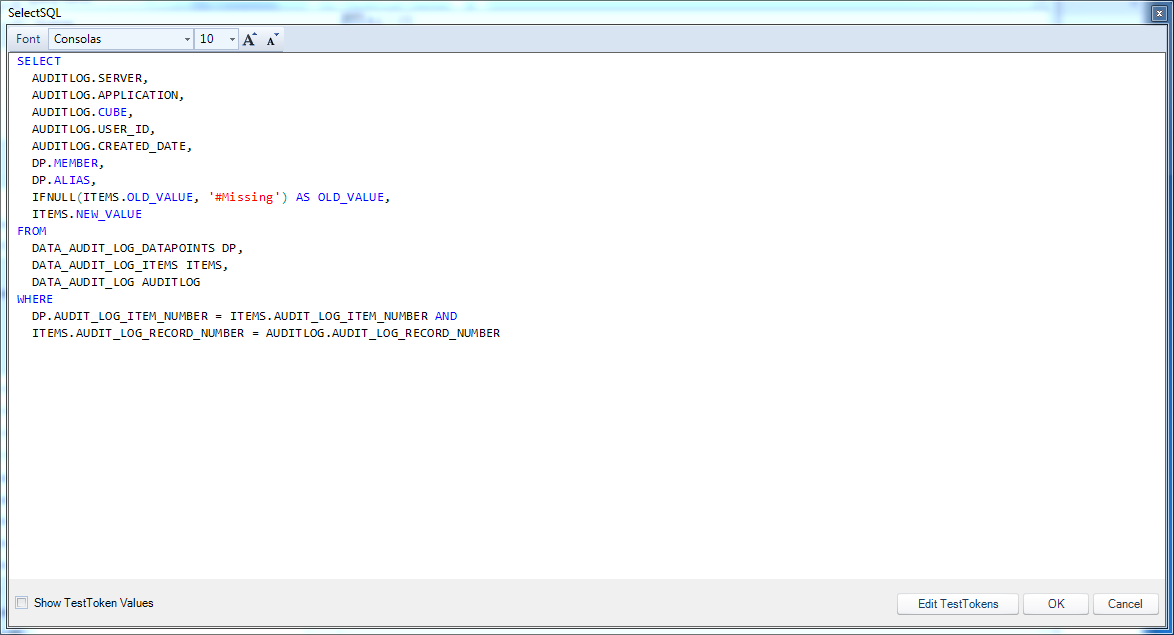
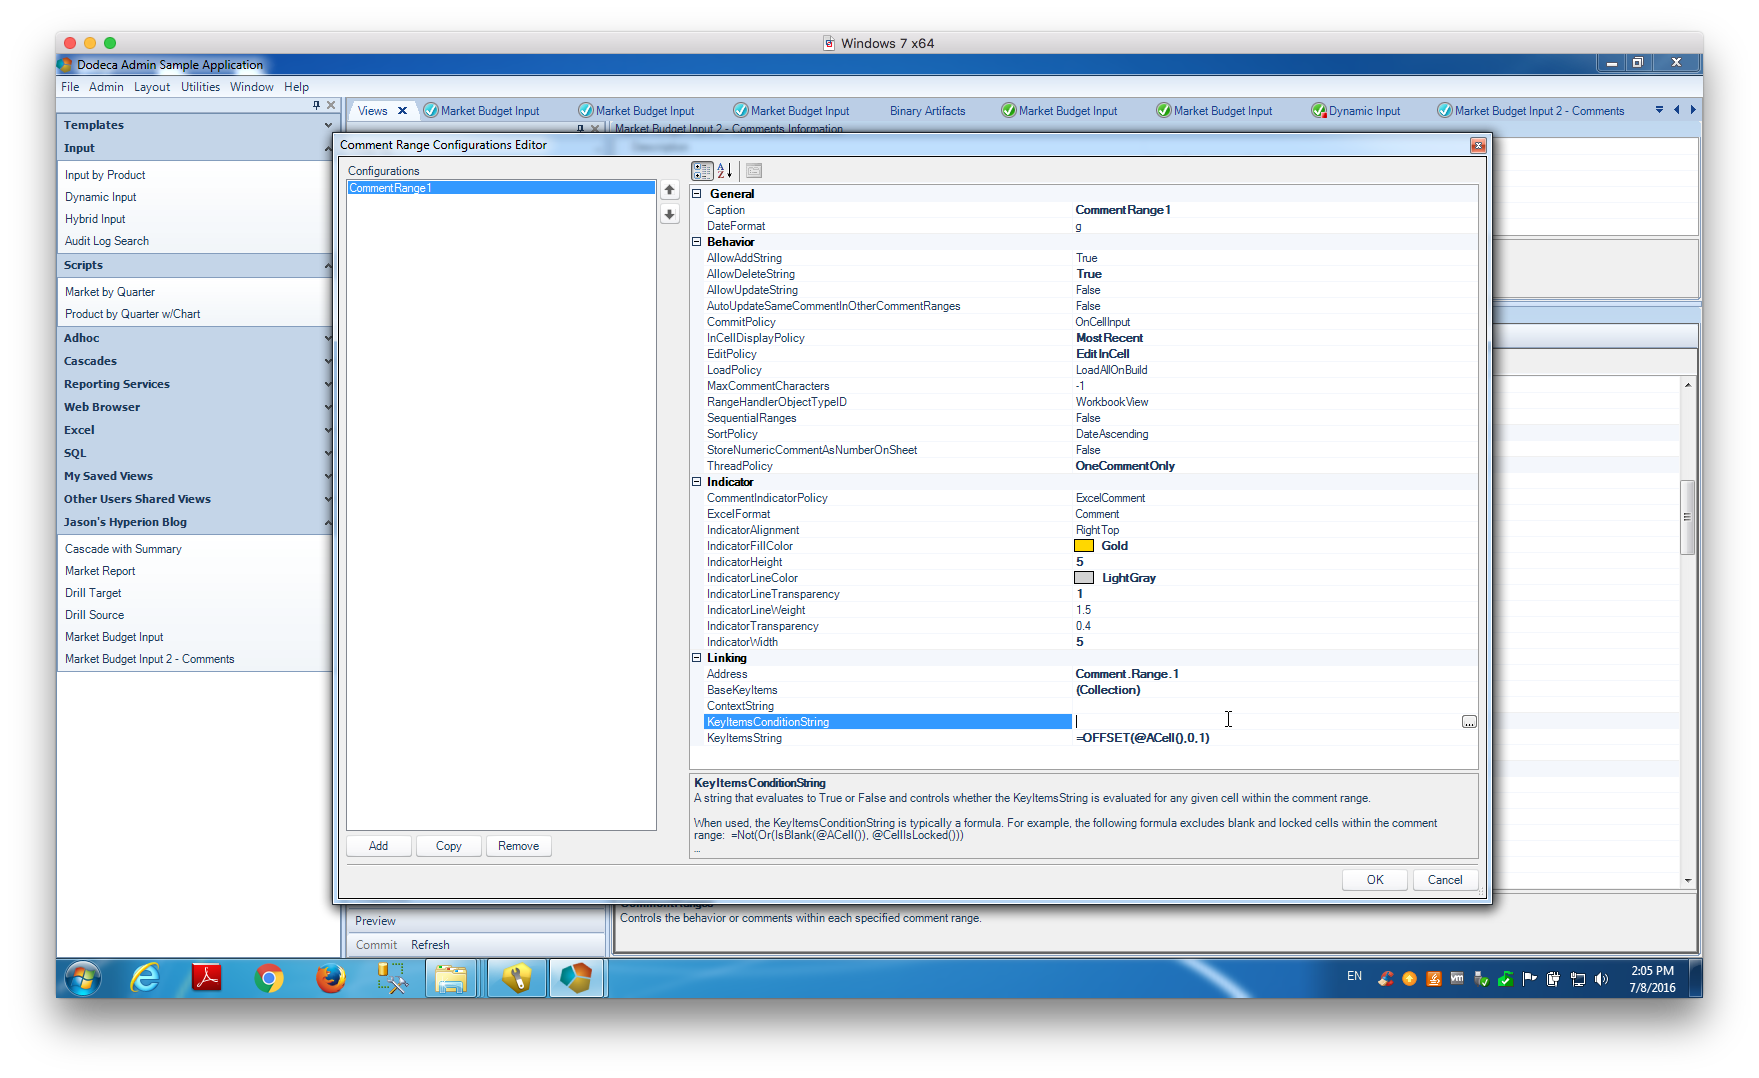
To get a flavor for what the various queries look like, here’s the UpdateSQL configuration:
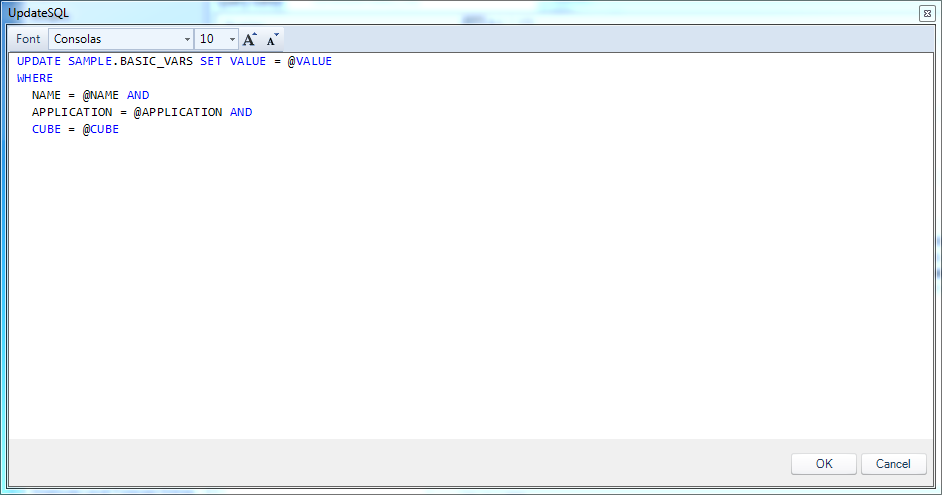
Dodeca UpdateSQL query for updating a variable’s value
You can see that the particular variable is identified by three column values (the primary key values), and that the value gets updated for this operation. There are four tokens in play, which will come from the row being edited in the view. There’s no primary key value being generated on the server-side (some of my previous examples had an integer that was generated server-side), so there’s no need for a post-insert select statement.
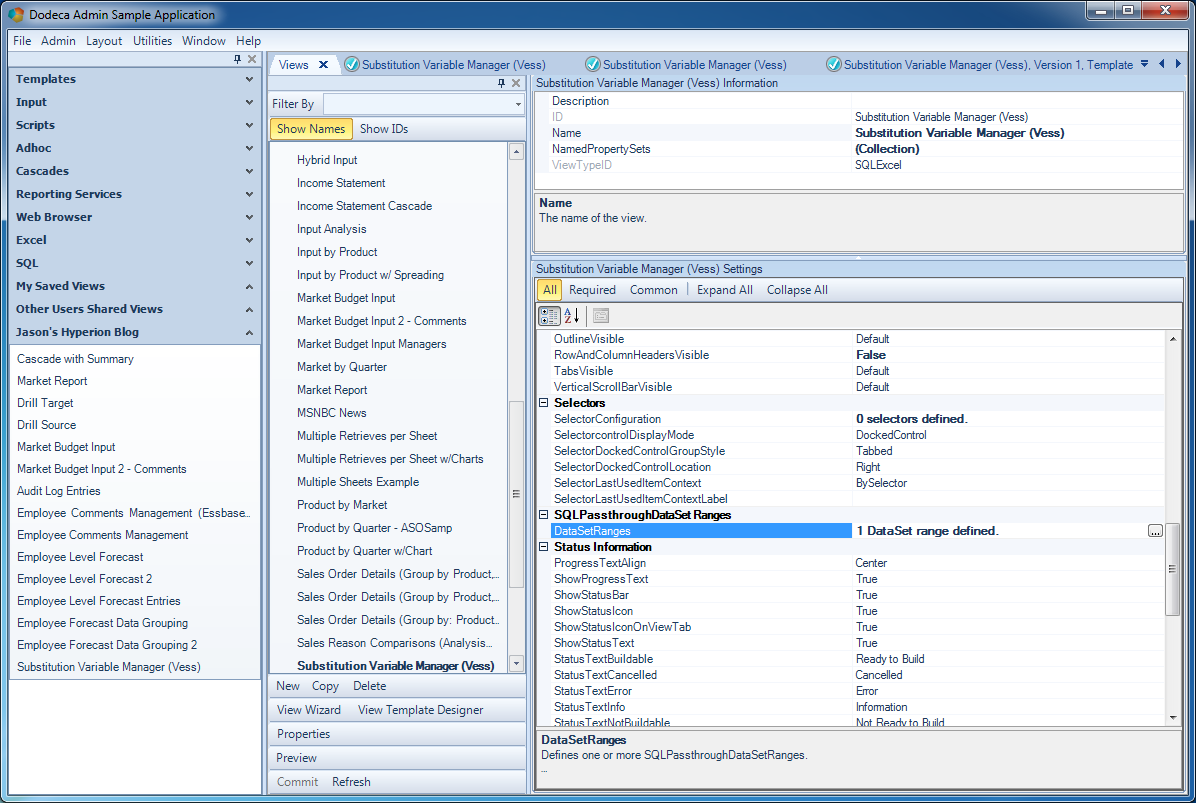
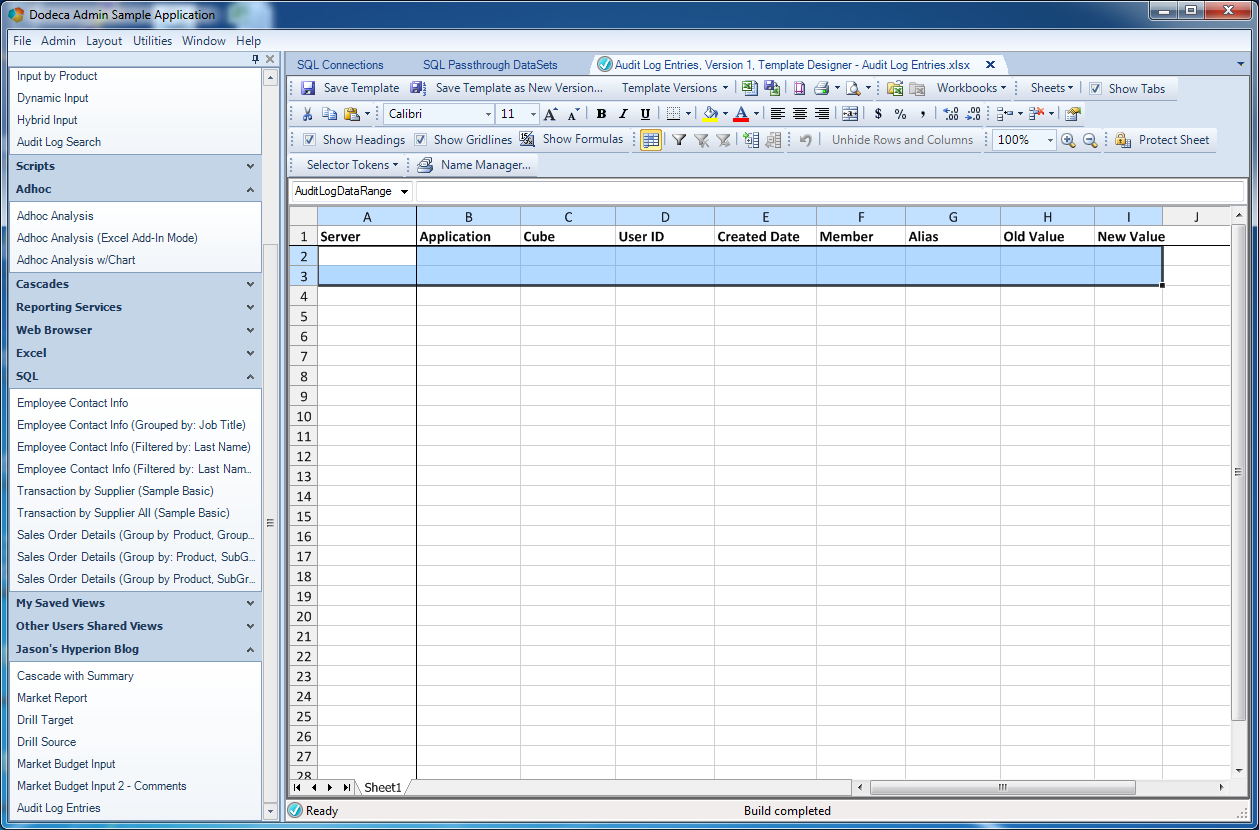
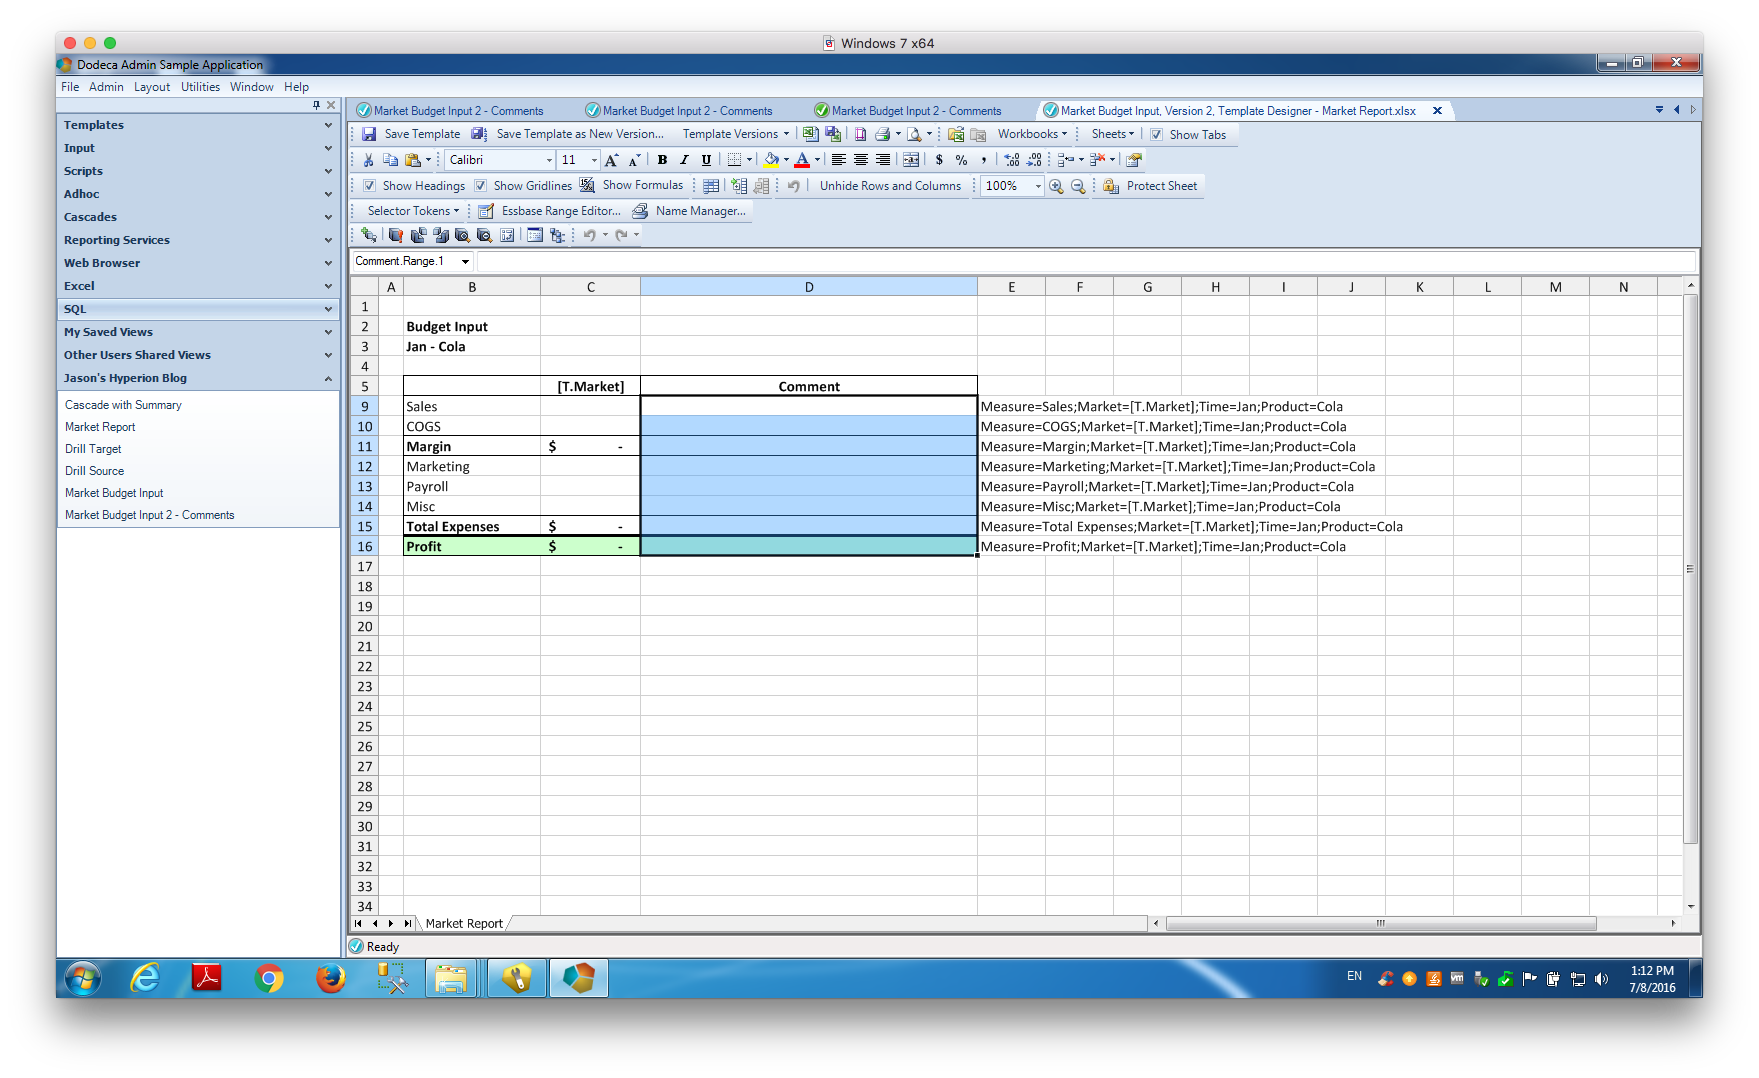
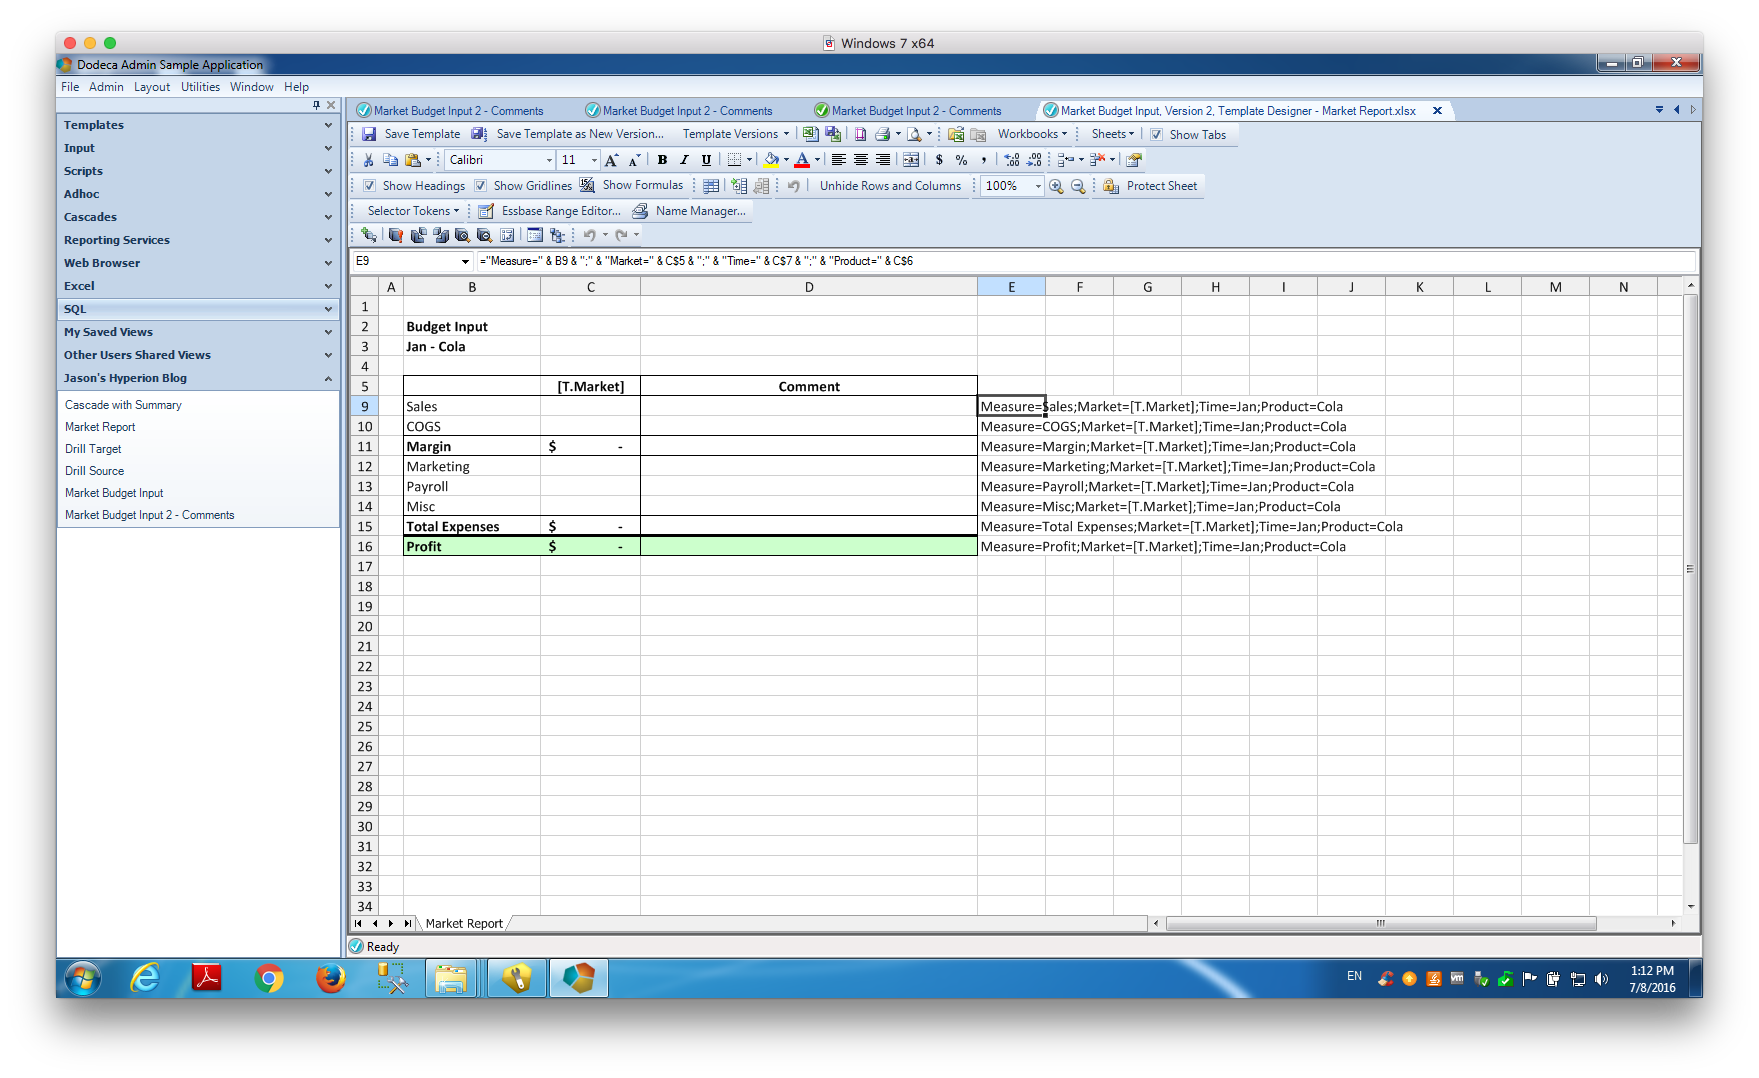
With all of the SQL Passthrough DataSet configuration out of the way (but a little more to come on the view configuration), I can now build a simple view template for showing the data:
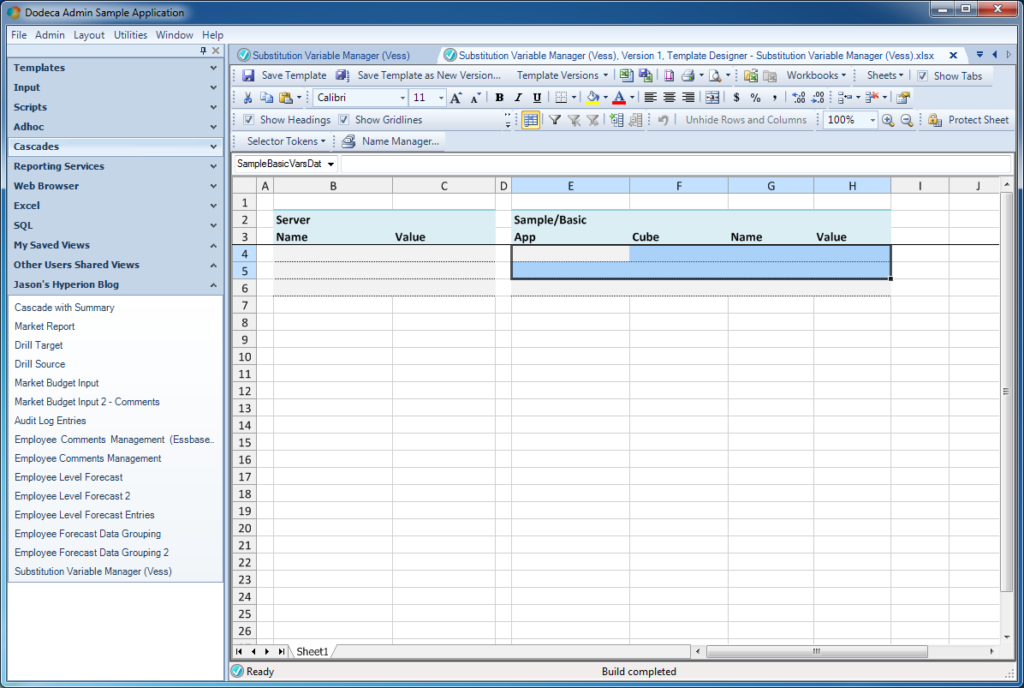
Creating a template to display the variables from the SQL Passthrough DataSet
If you’ve followed some of my other examples, this should seem pretty basic by now. There are two data ranges on this sheet but I’m just showing one in the preceding screenshot. The dataset has four columns, and so there are four columns on the range. That’s actually all there is to the view template itself. The rest of the configuration is on the view to set its data range and wire it up to the SQL Passthrough DataSet:

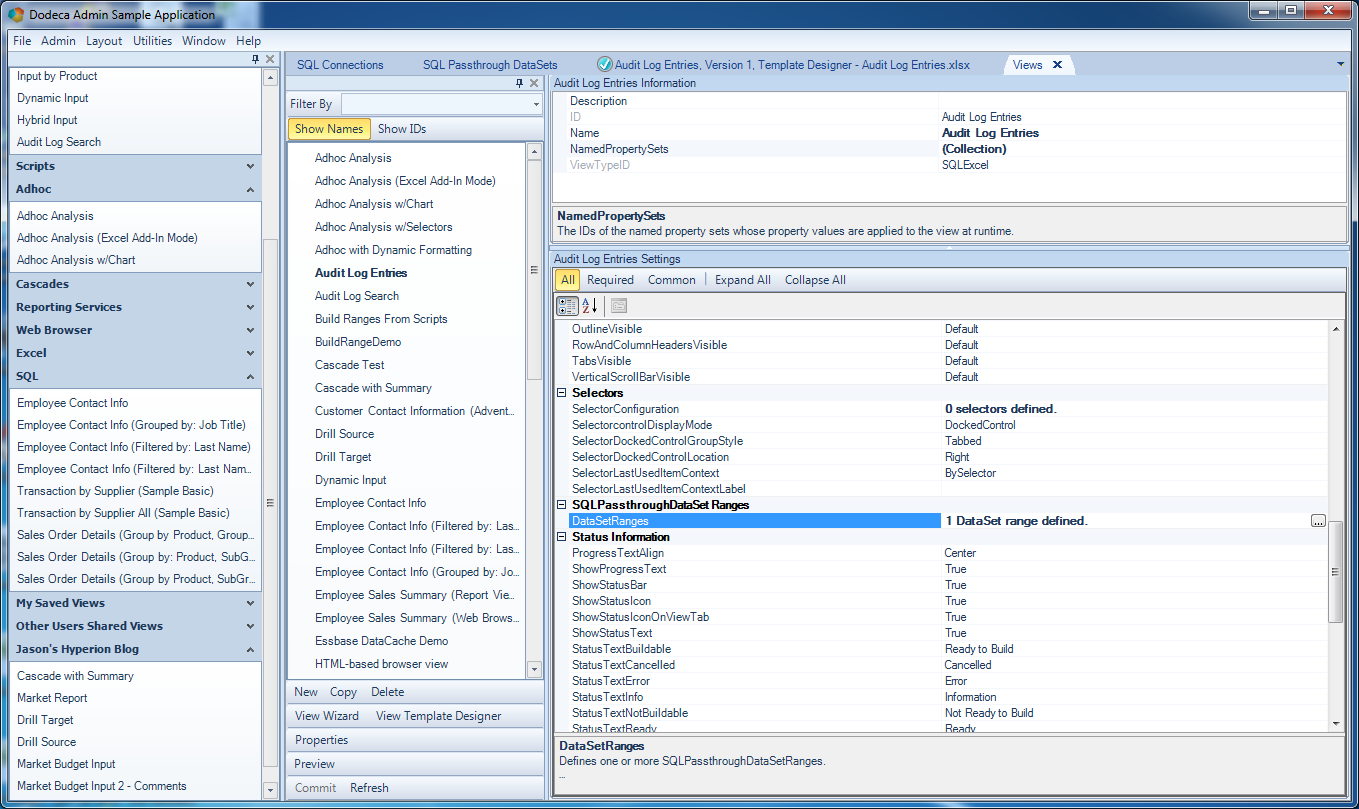
The configuration of the View that will display/edit the variables
Noting too special here. You can see that I turned off RowAndColumnHeadersVisible to clean up the final appearance of the view a bit, and I have my one DataSet range defined. Over in the DataSet range definition:
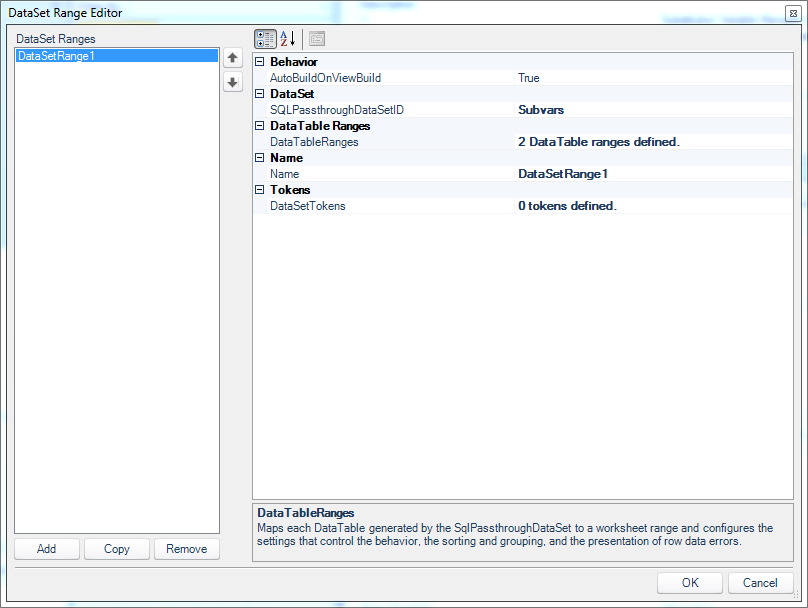
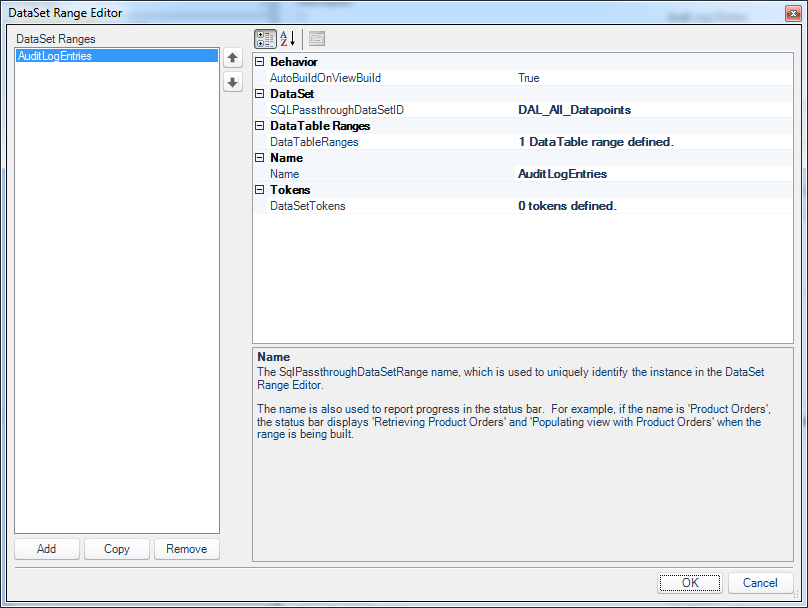
The DataSet Range definition for the view
There are two DataTable ranges defined (again, one for server variables and one for the Sample/Basic variables). Now opening up the configuration for the SampleBasicVarsData range (I’ll skip showing the details on the server variables range since it’s pretty simple):
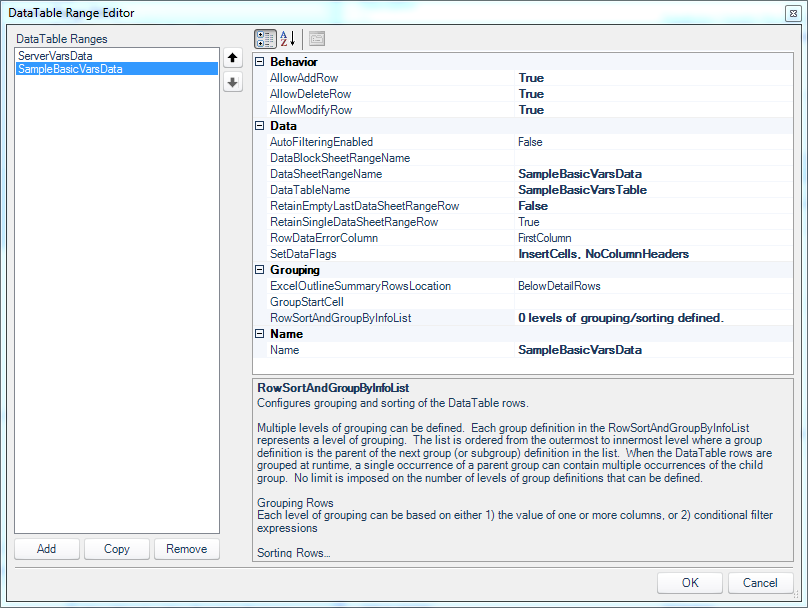
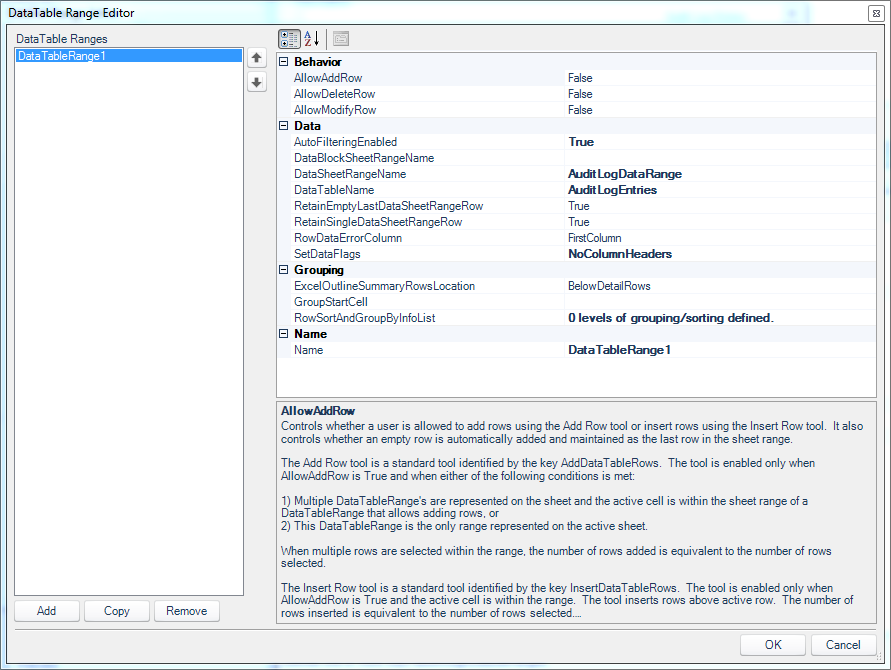
DataTable Range Editor for the Sample/Basic data set
I’ve turned on the abilities to add, delete, and modify rows (INSERT, DELETE, UPDATE). This is a really nice bit of granularity to have in Dodeca since in this case there’s a very legitimate use-case where I’d perhaps want a user to only be able to change a variable’s value but not otherwise delete it or add a new variable. Other than that bit of configuration, I’ve specified the corresponding range name on the sheet/template, and turned on InsertCells and NoColumnHeaders which is fairly standard for me with data sets like this.
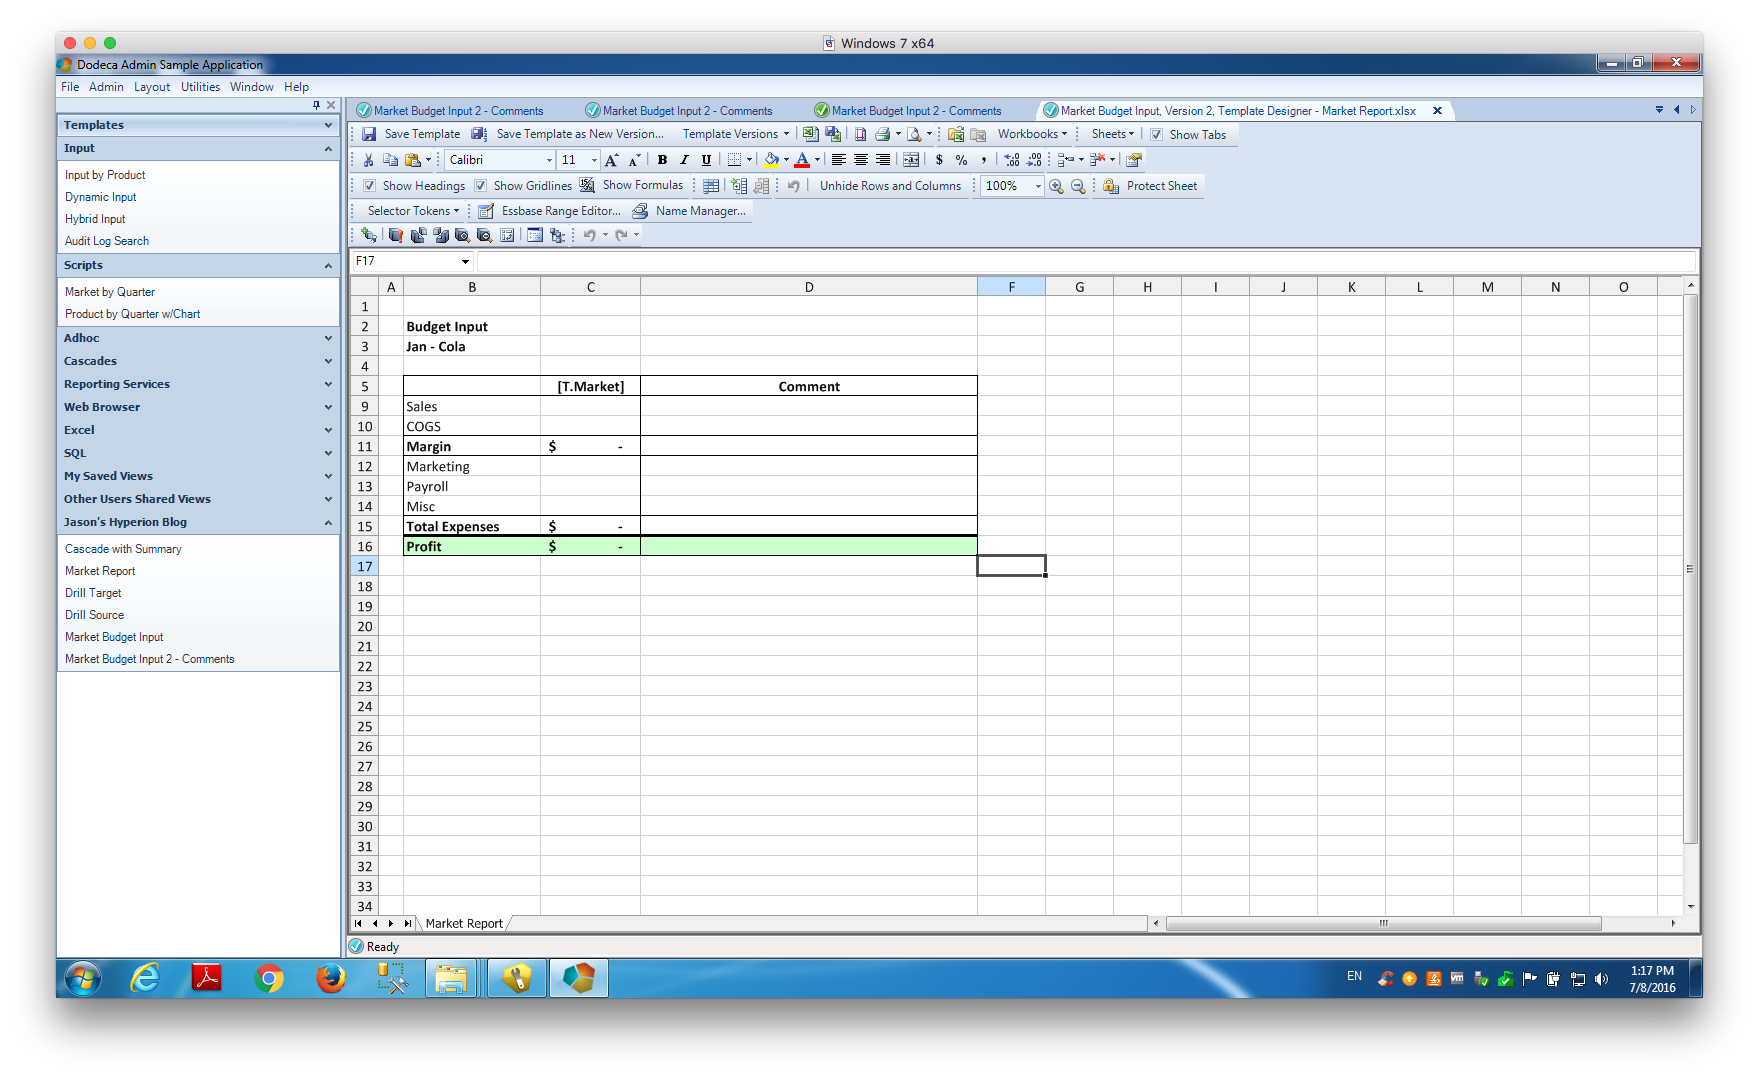
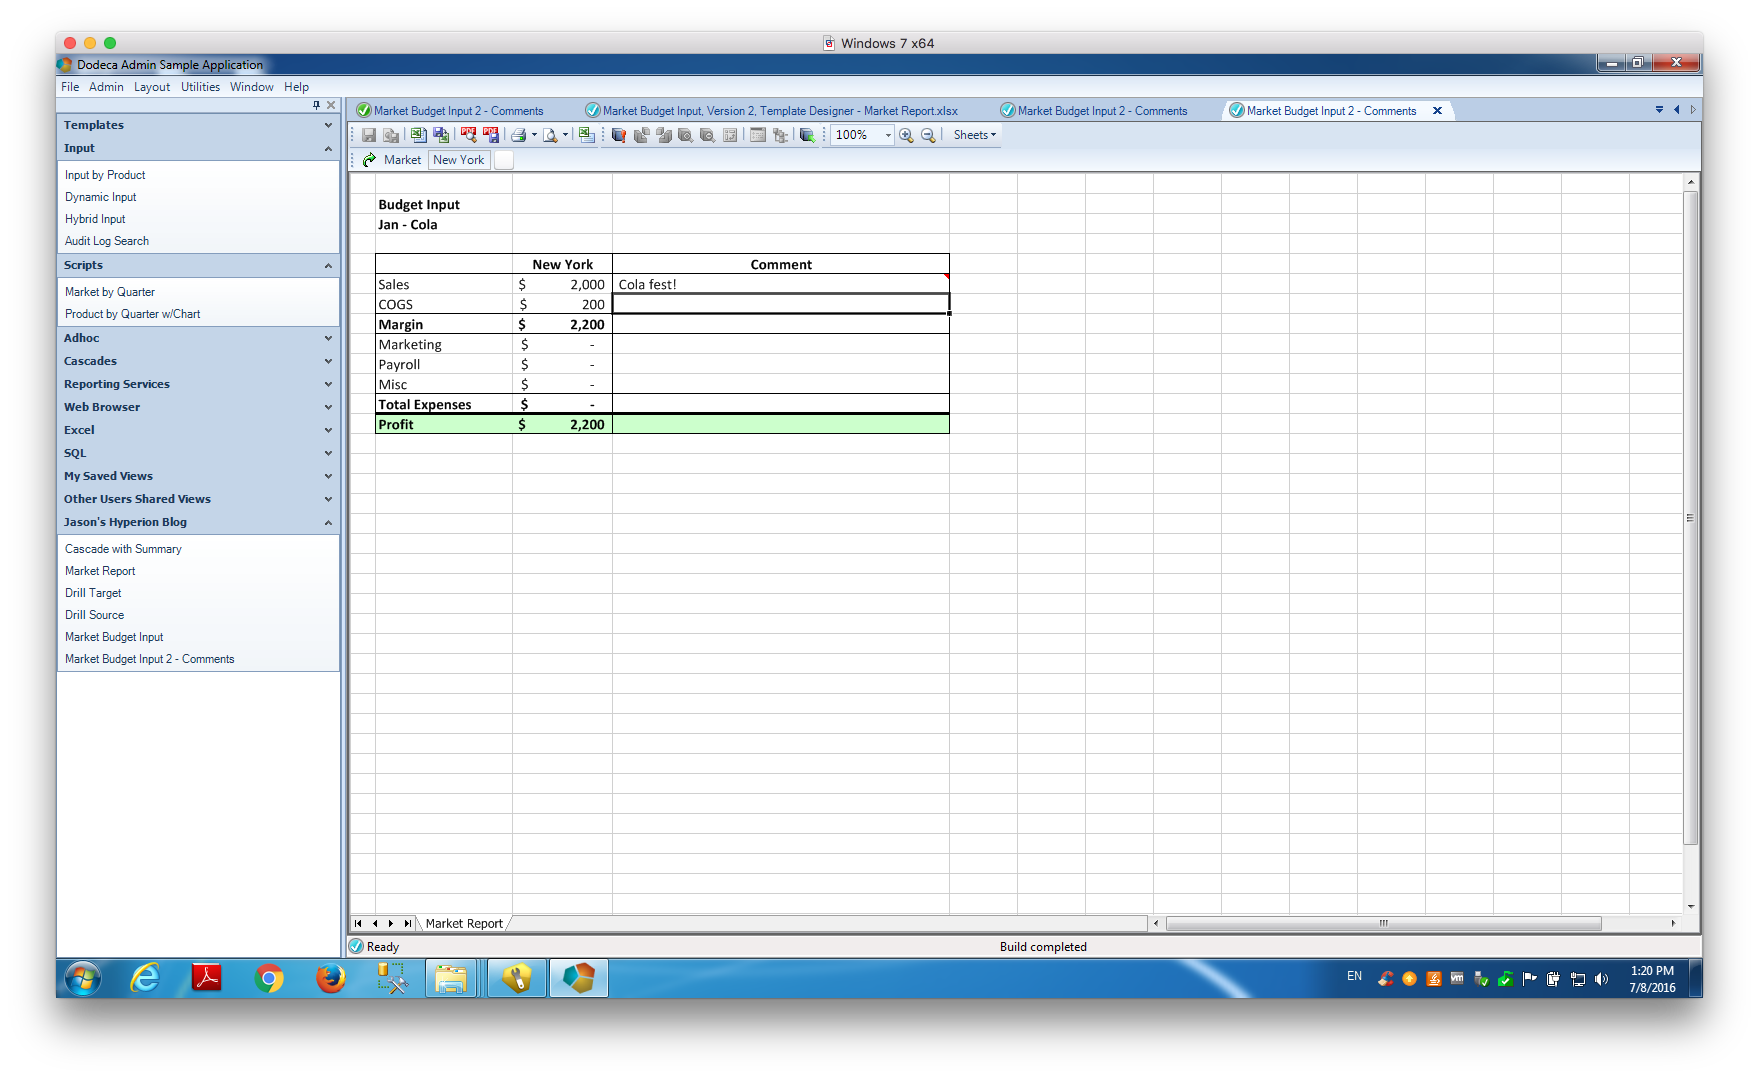
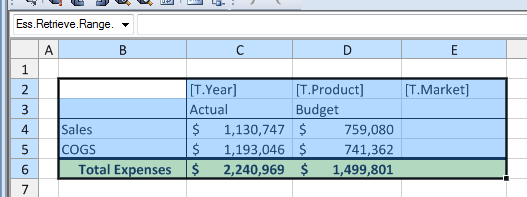
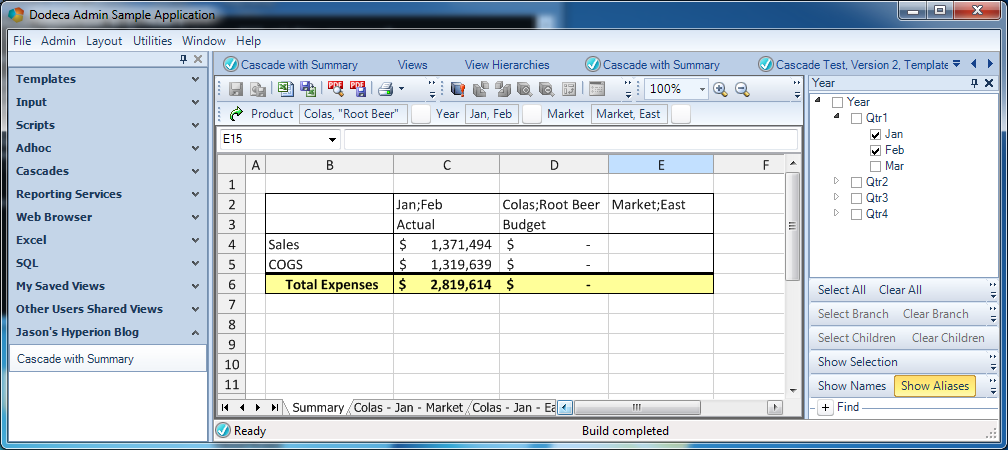
Okay, the SQL Passthrough DataSet is setup, the template is setup, and the view configuration is setup. Let’s build this and see what happens:
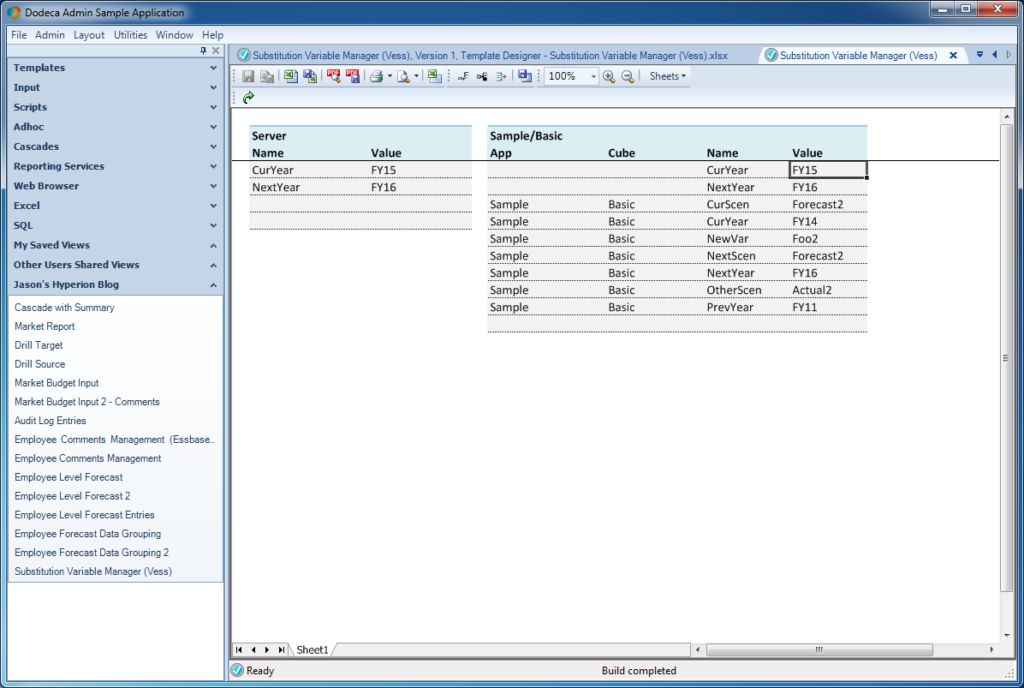
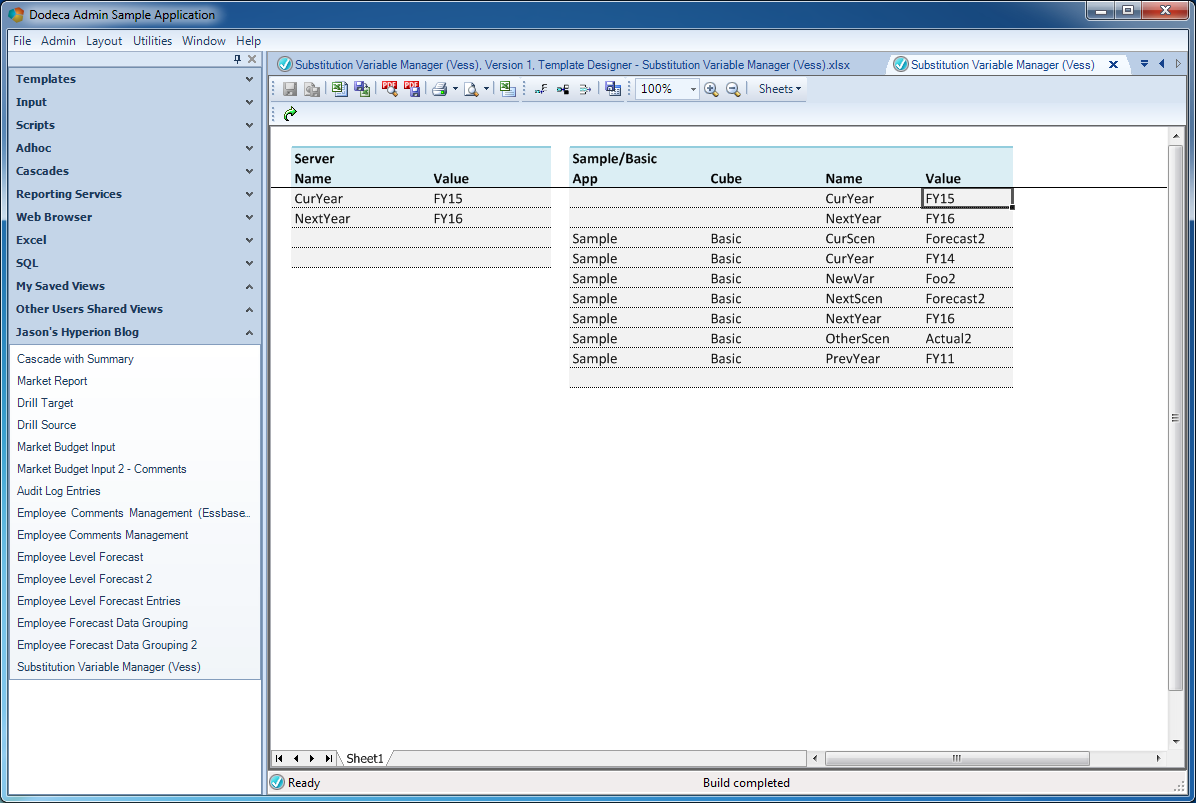
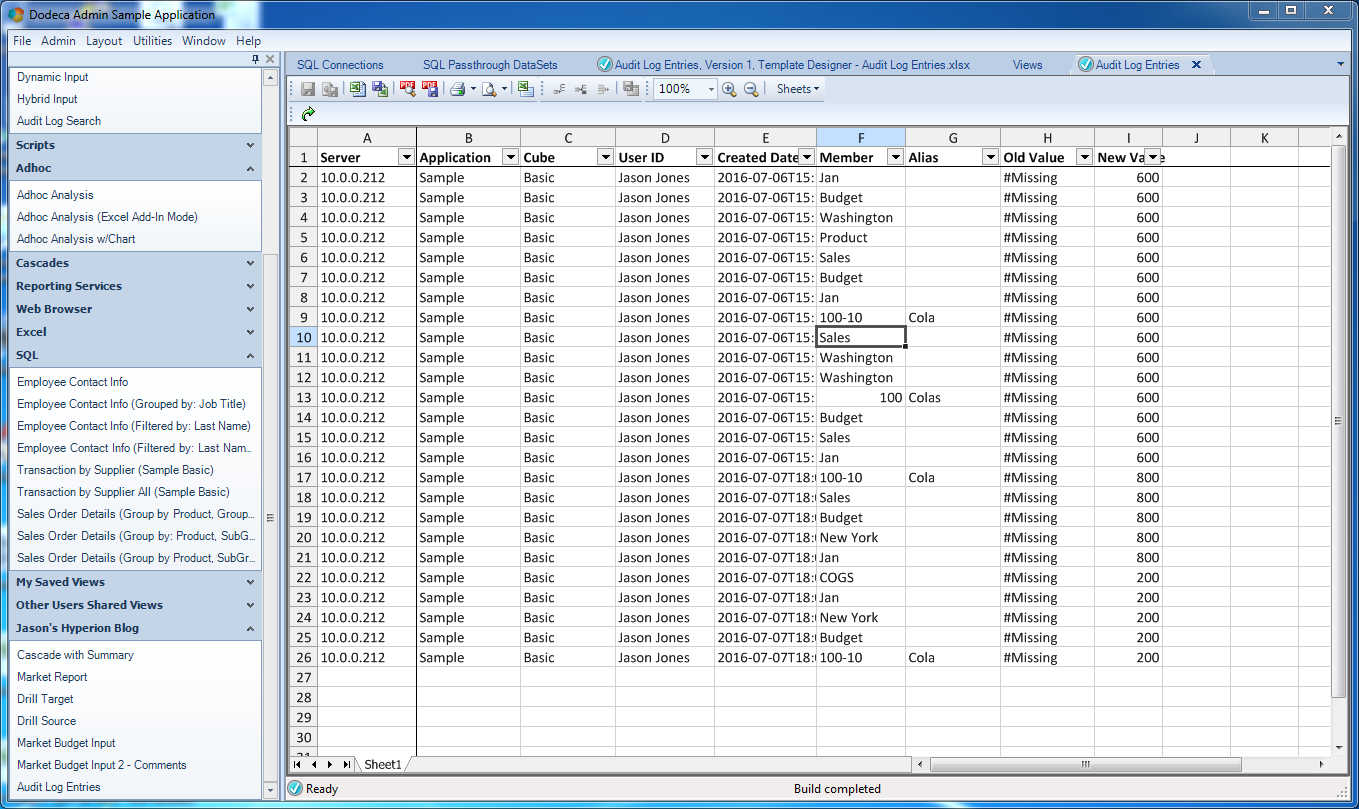
Built Substitution Variable view
It looks just like I thought it would! I can see my two server-wise substitution variables, and over on the table for Sample/Basic, I can see all of the variables that I have there. You’ll note that the server-wise variables seem to “repeat” in the Sample/Basic table. You simply have to think of the variables for a single database in terms of what variables are applicable to that database, and server-wide variables are applicable. Of course, if there’s a more specific (specified to the database) variable, it’ll trump the server-wide variable.
If you’re particularly astute with your screenshot reading skills you may notice that in preceding shot the cursor is on a cell in the Sample/Basic variables table, and therefore the row editing buttons on the toolbar are active (insert, delete, save). So I can change a value on a variable, hit the save data button, and Dodeca will perform the proper query from the SQLPTDS. Let’s do that and see what happens:

View after updating a variable value
Well, it’s certainly less dramatic with screenshots, you’ll have to take my word for it that the PrevYear variable did indeed update on the server from FY11 to FY10. Under the hood, Dodeca fired off the properly filled in UpdateSQL statement, which of course was handed to the Vess driver, and in turn, Vess translated the call and called the appropriate variable updating logic on the Essbase Java API (magic!).
Summary / Vess Availability & Download
I hope you enjoyed this somewhat unique (or totally unique, I suppose) combination of a couple of different technologies. Vess is a bit of a unique take on things in the Essbase world, whereas Dodeca provides the peas to Essbase’s carrots. And yet, combining the two results in something wildly “interesting”.
I’m not saying that organizations should manage substitution variables this way (and again, the substitution variable aspect of Vess is just one of its facets, but it’s a nice simple one to play with), but this certainly makes it quite possible.
I know of many organizations that specifically or rather, begrudgingly, give EAS to a handful of finance power users that need to be able to tweak variables. Sometimes instead of EAS you’ll see one-off MaxL scripts where the update procedure is to tweak the script or a text file and run it. All too often this also involves plain-text credentials, hassling with installing the MaxL runtime on a ‘regular’ desktop machine, and more. So in this particular case, while the Vess driver actually does a lot more than just substitution variables, it can be leveraged for an innovative solution that is “cleaner” than many alternatives.
As an alternative (and still using Dodeca), we could have actually shelled out to launch a MaxL script and pass along the variable value, achieving much the same effect. This could work but obviously would be much more configuration. And to the extent possible I don’t like to create solutions that are ostensibly web-based that need to “drop down to the file system”, since it usually (in my experience), introduces a somewhat fragile or ‘sensitive’ element to the system that seems to act up or break relatively often.
Vess is still “highly experimental”, which I guess is a nice way of saying “a lot of things can go wrong, there’s no warranty, but it works… mostly. Asterisk.” Anyway, Vess isn’t available as a public download, but if you’d like to play with it, please feel free to contact me and I can provide the file and some basic instructions.